Introducing Defensive Workflows
Applying the volatility lens to defensive trade intents
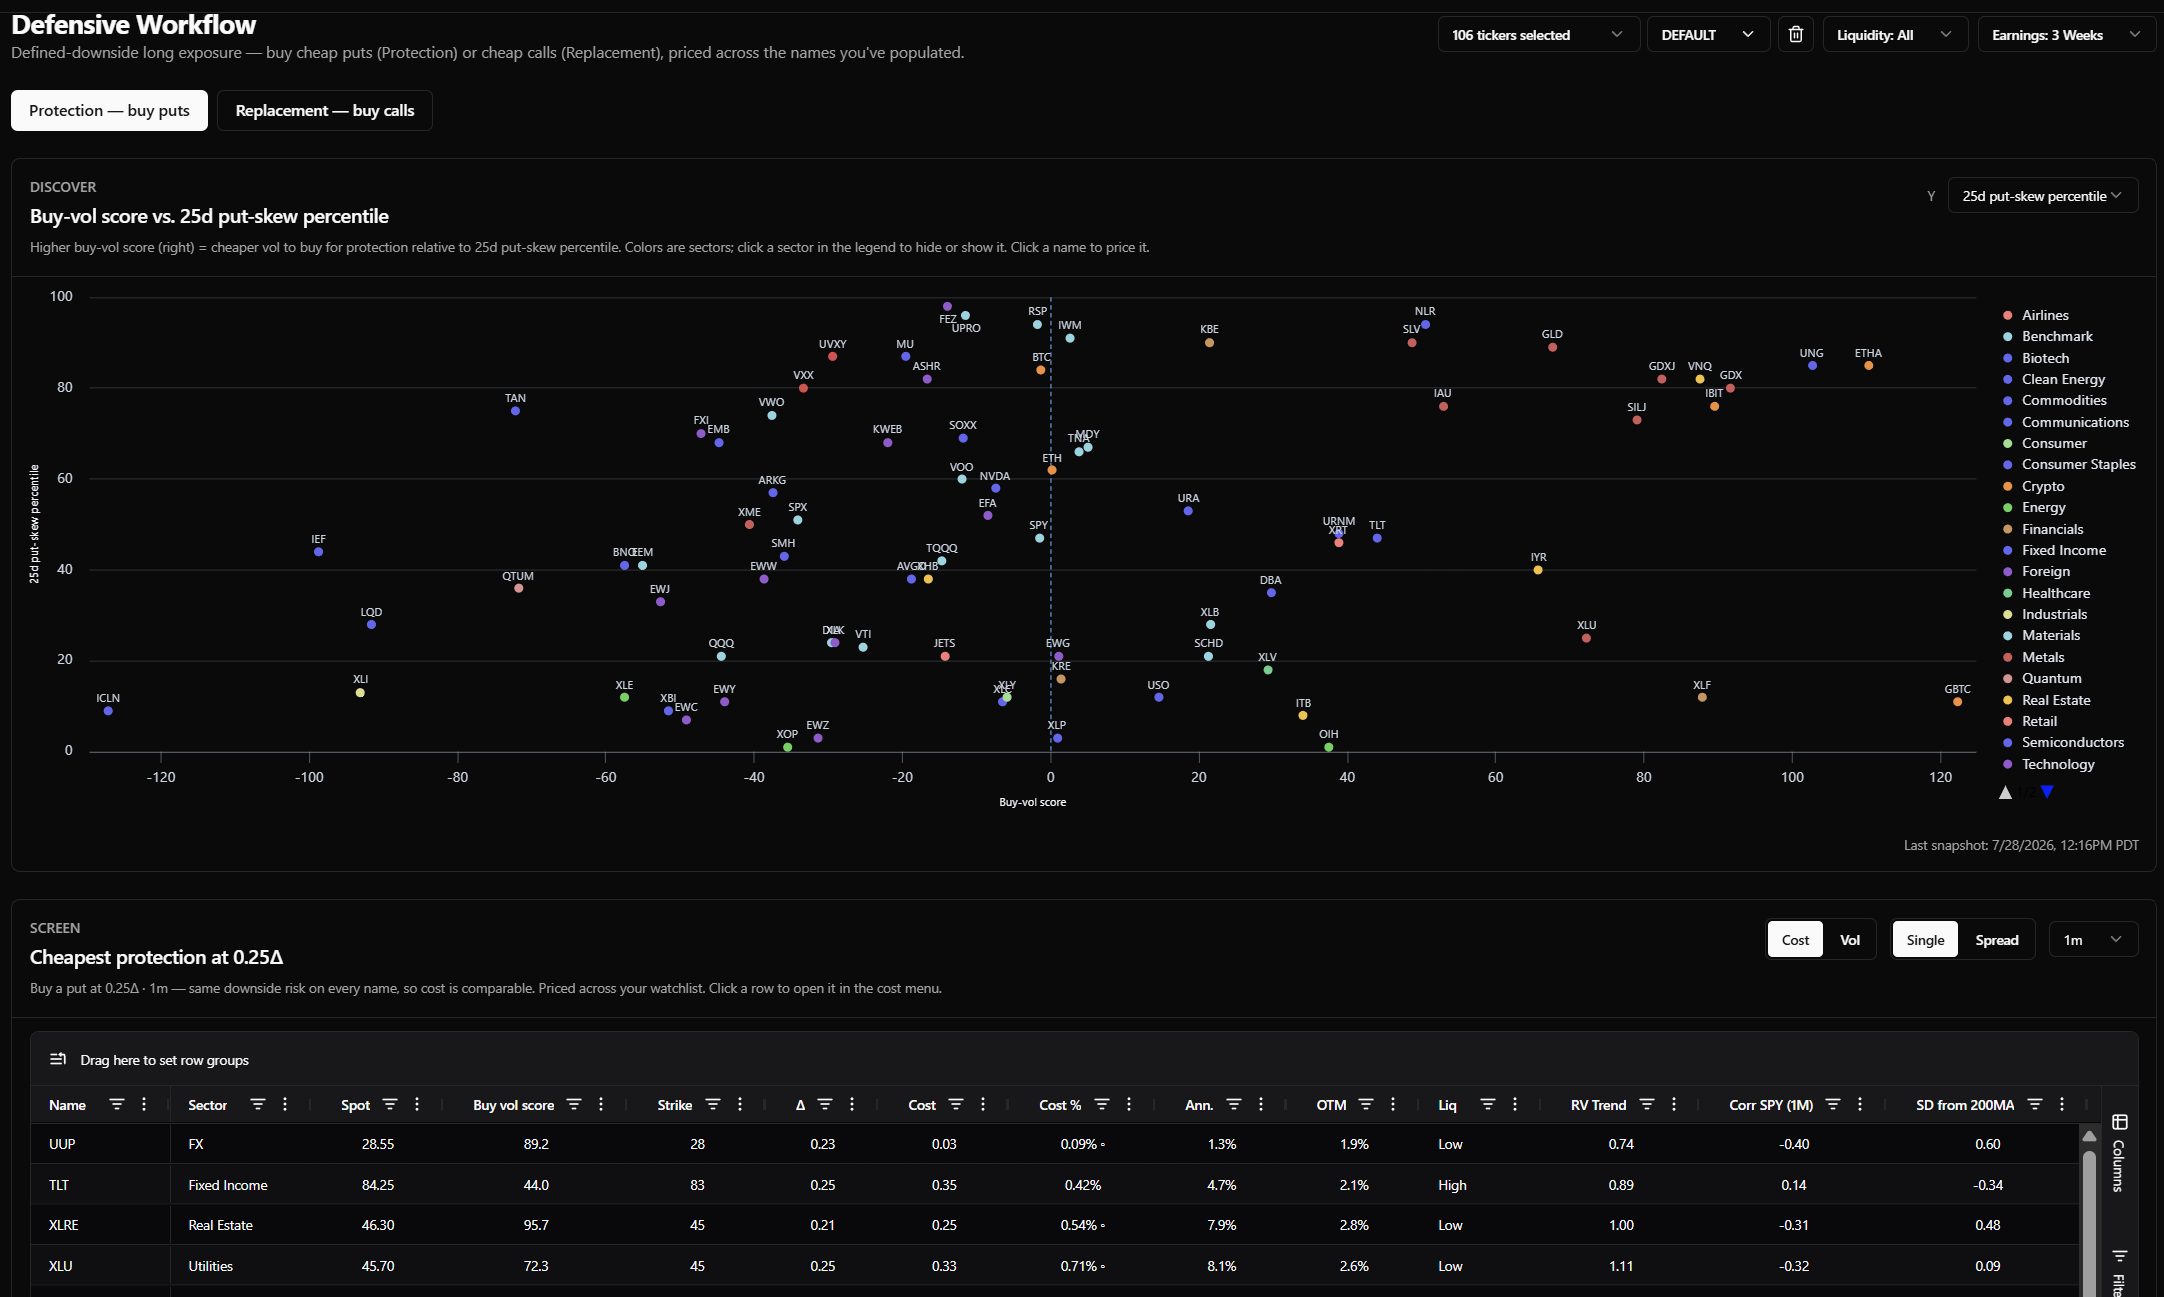
The Defensive Workflow prices downside protection and stock replacement across the names you follow. It answers one question in two forms: what does defined-risk long exposure cost right now, and where is it cheapest? It sits in the sidebar under Workflows → Defensive.
Two buttons at the top of the page set which form you're in:
- Protection — buy puts. You hold the stock and want a floor under it.
- Replacement — buy calls. You swap the stock for a call and keep the difference in cash.
Everything below re-prices when you switch. The page then runs three panels top to bottom: Discover, Screen, Evaluate.
Scope controls
The same three controls as the other workflows govern every panel: the ticker selector (your universe), the liquidity tier filter, and exclude earnings weeks.
1. Discover
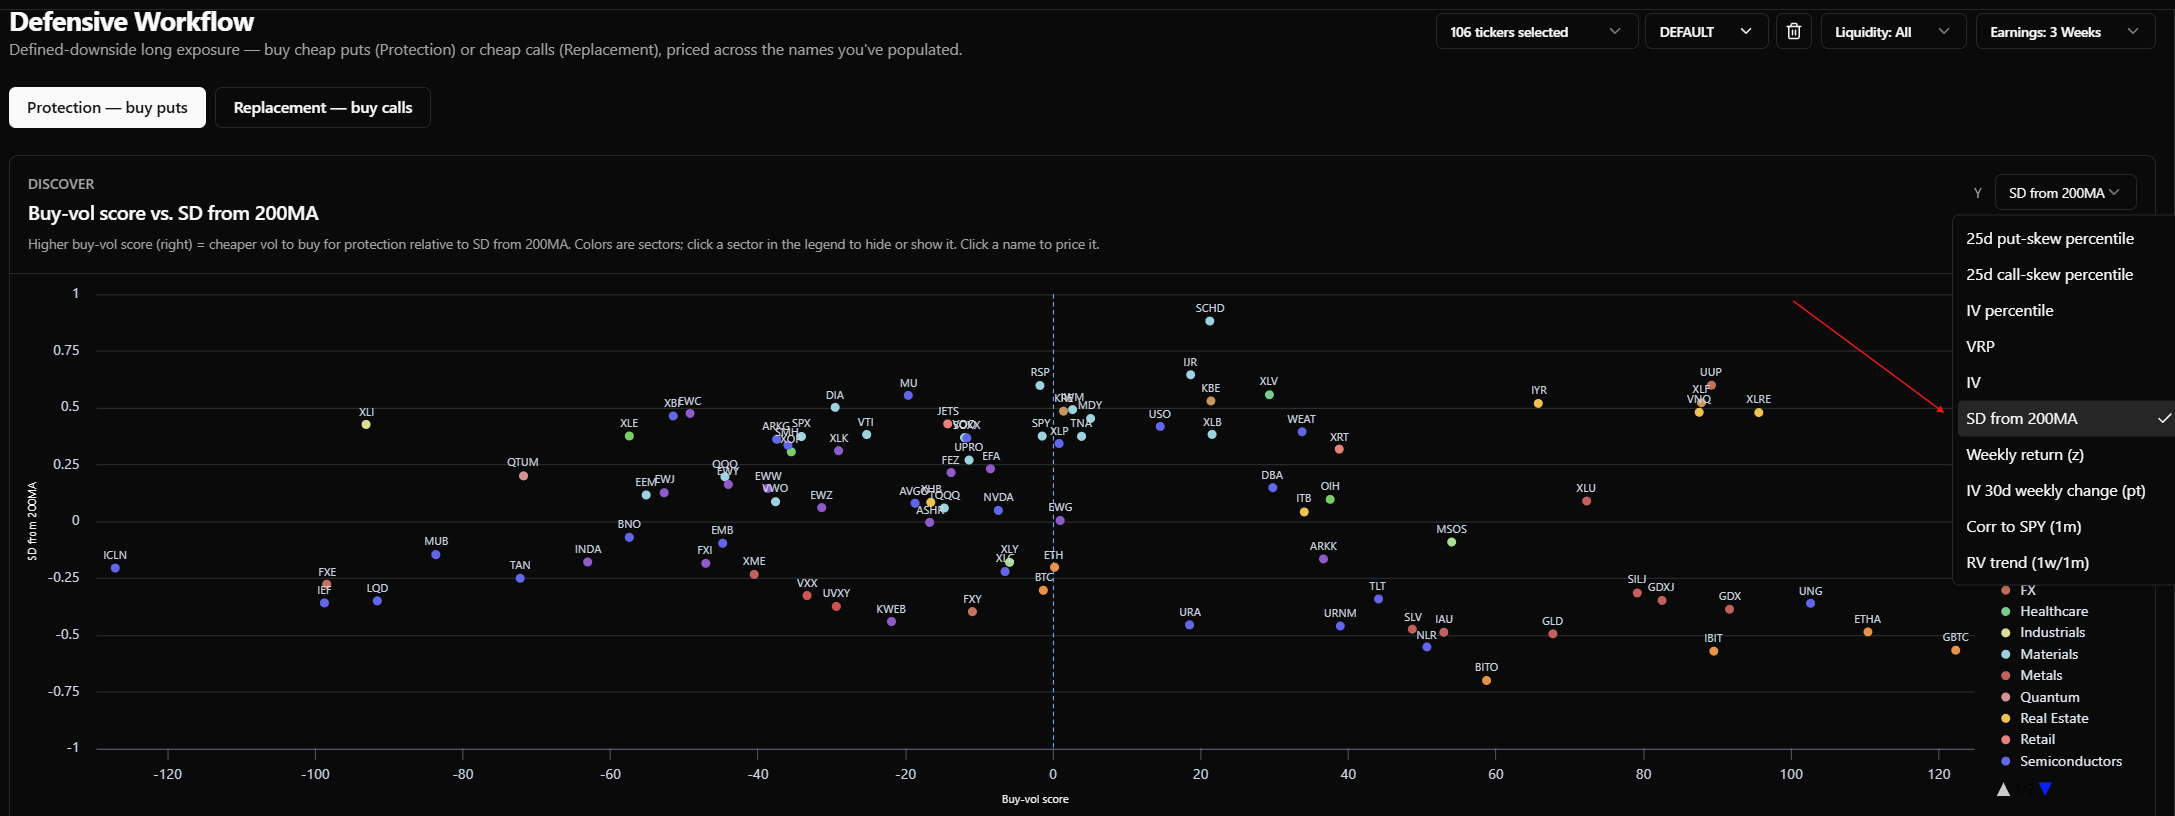
The X-axis is the buy-vol score — cheapness of volatility rather than richness. Y is yours from ten measures: 25d put-skew percentile, 25d call-skew percentile, IV percentile, VRP, IV, SD from 200MA, weekly return (z), IV 30d weekly change, correlation to SPY, and RV trend.
Dots are sector-colored and the legend filters the plot — click a sector to hide it. Clicking a dot sends that name to Evaluate.
2. Screen
Chips across the top:
- Cost / Vol — Cost ranks by the cheapest protection outright; Vol ranks by the buy-vol score with the side-relevant skew as tiebreak.
- Single / Spread — one leg, or a spread that sells a further-out strike to cut the cost.
- Tenor — 1m, 3m, 6m, 12m.
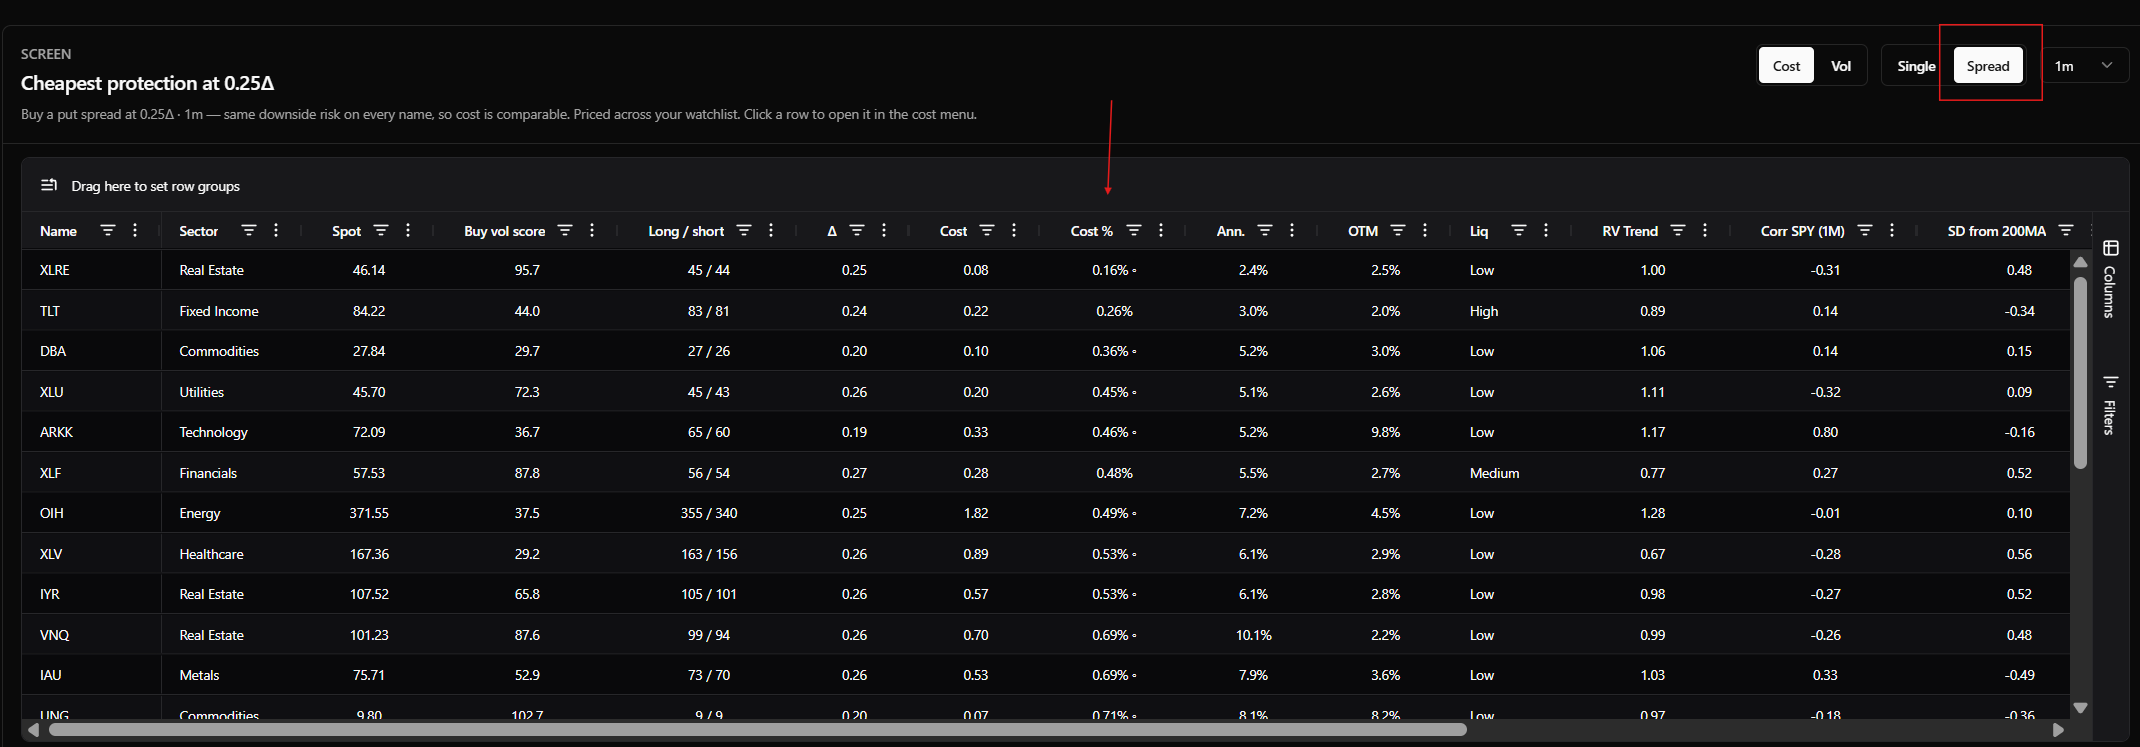
Every structure is struck at approximately 0.25 delta, so you're comparing the same amount of protection across names rather than comparing whoever happens to have a convenient strike.
Default columns: Name, Sector, Spot, Buy vol score, Strike (or Long / short in spread mode), Δ, Cost, Cost %, Ann., OTM, Liq, the bought-side skew percentile, plus RV Trend, Corr SPY and SD from 200MA. Protection mode adds Tail %. Spread mode adds Payoff.
Single option view
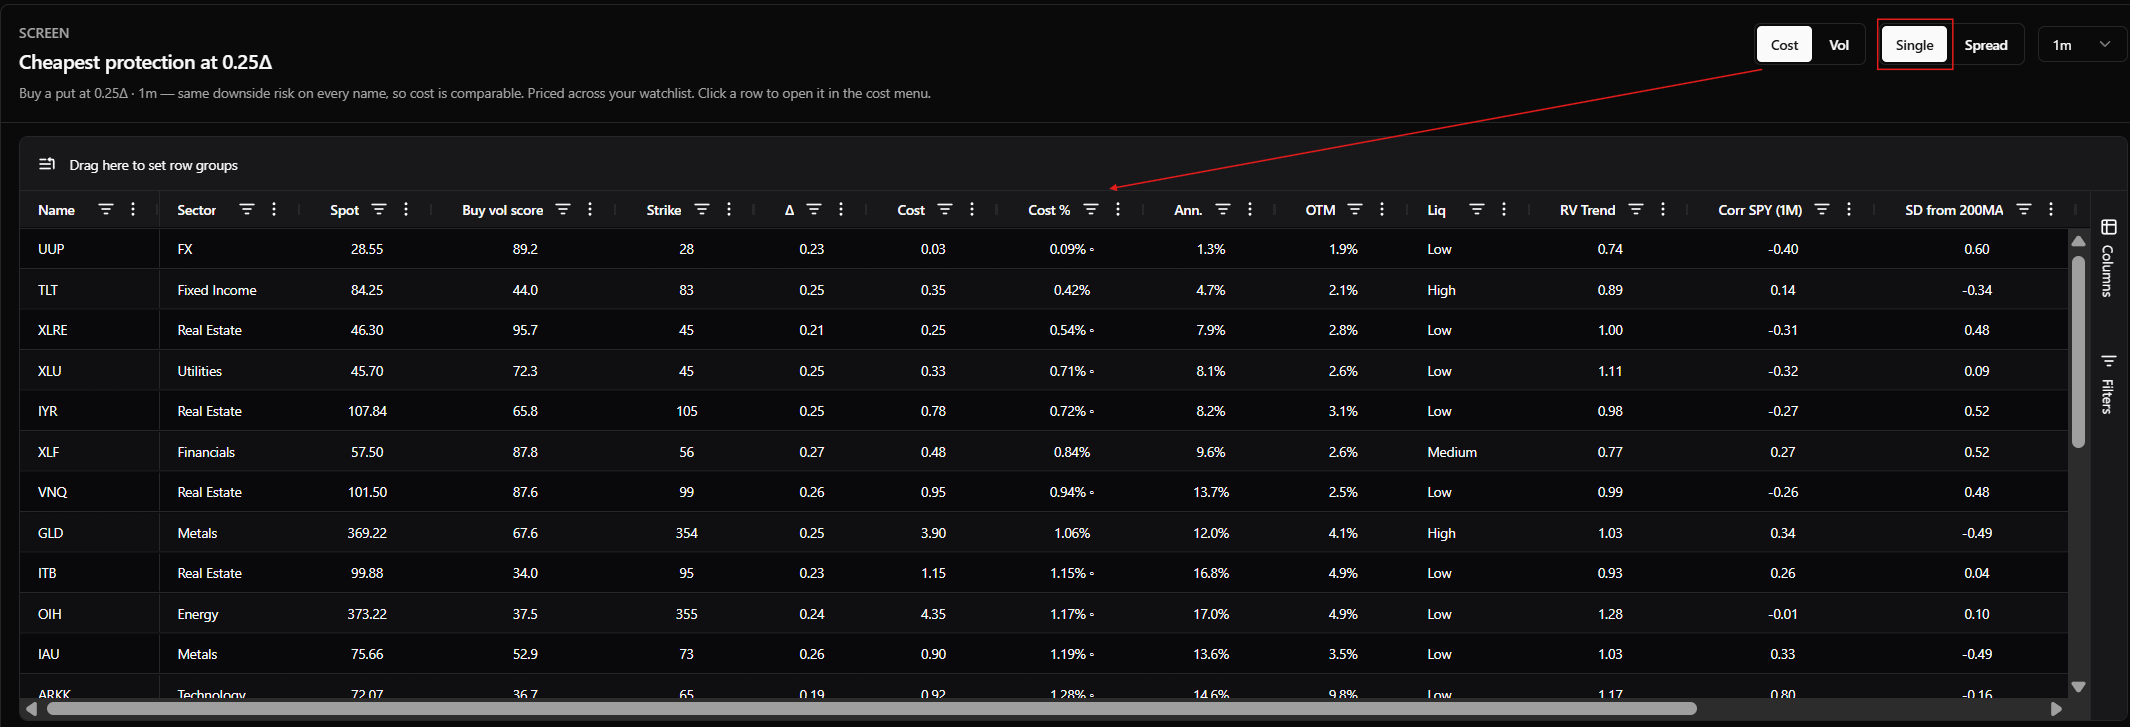
Finding the cheapest spread across names in the 1-month range
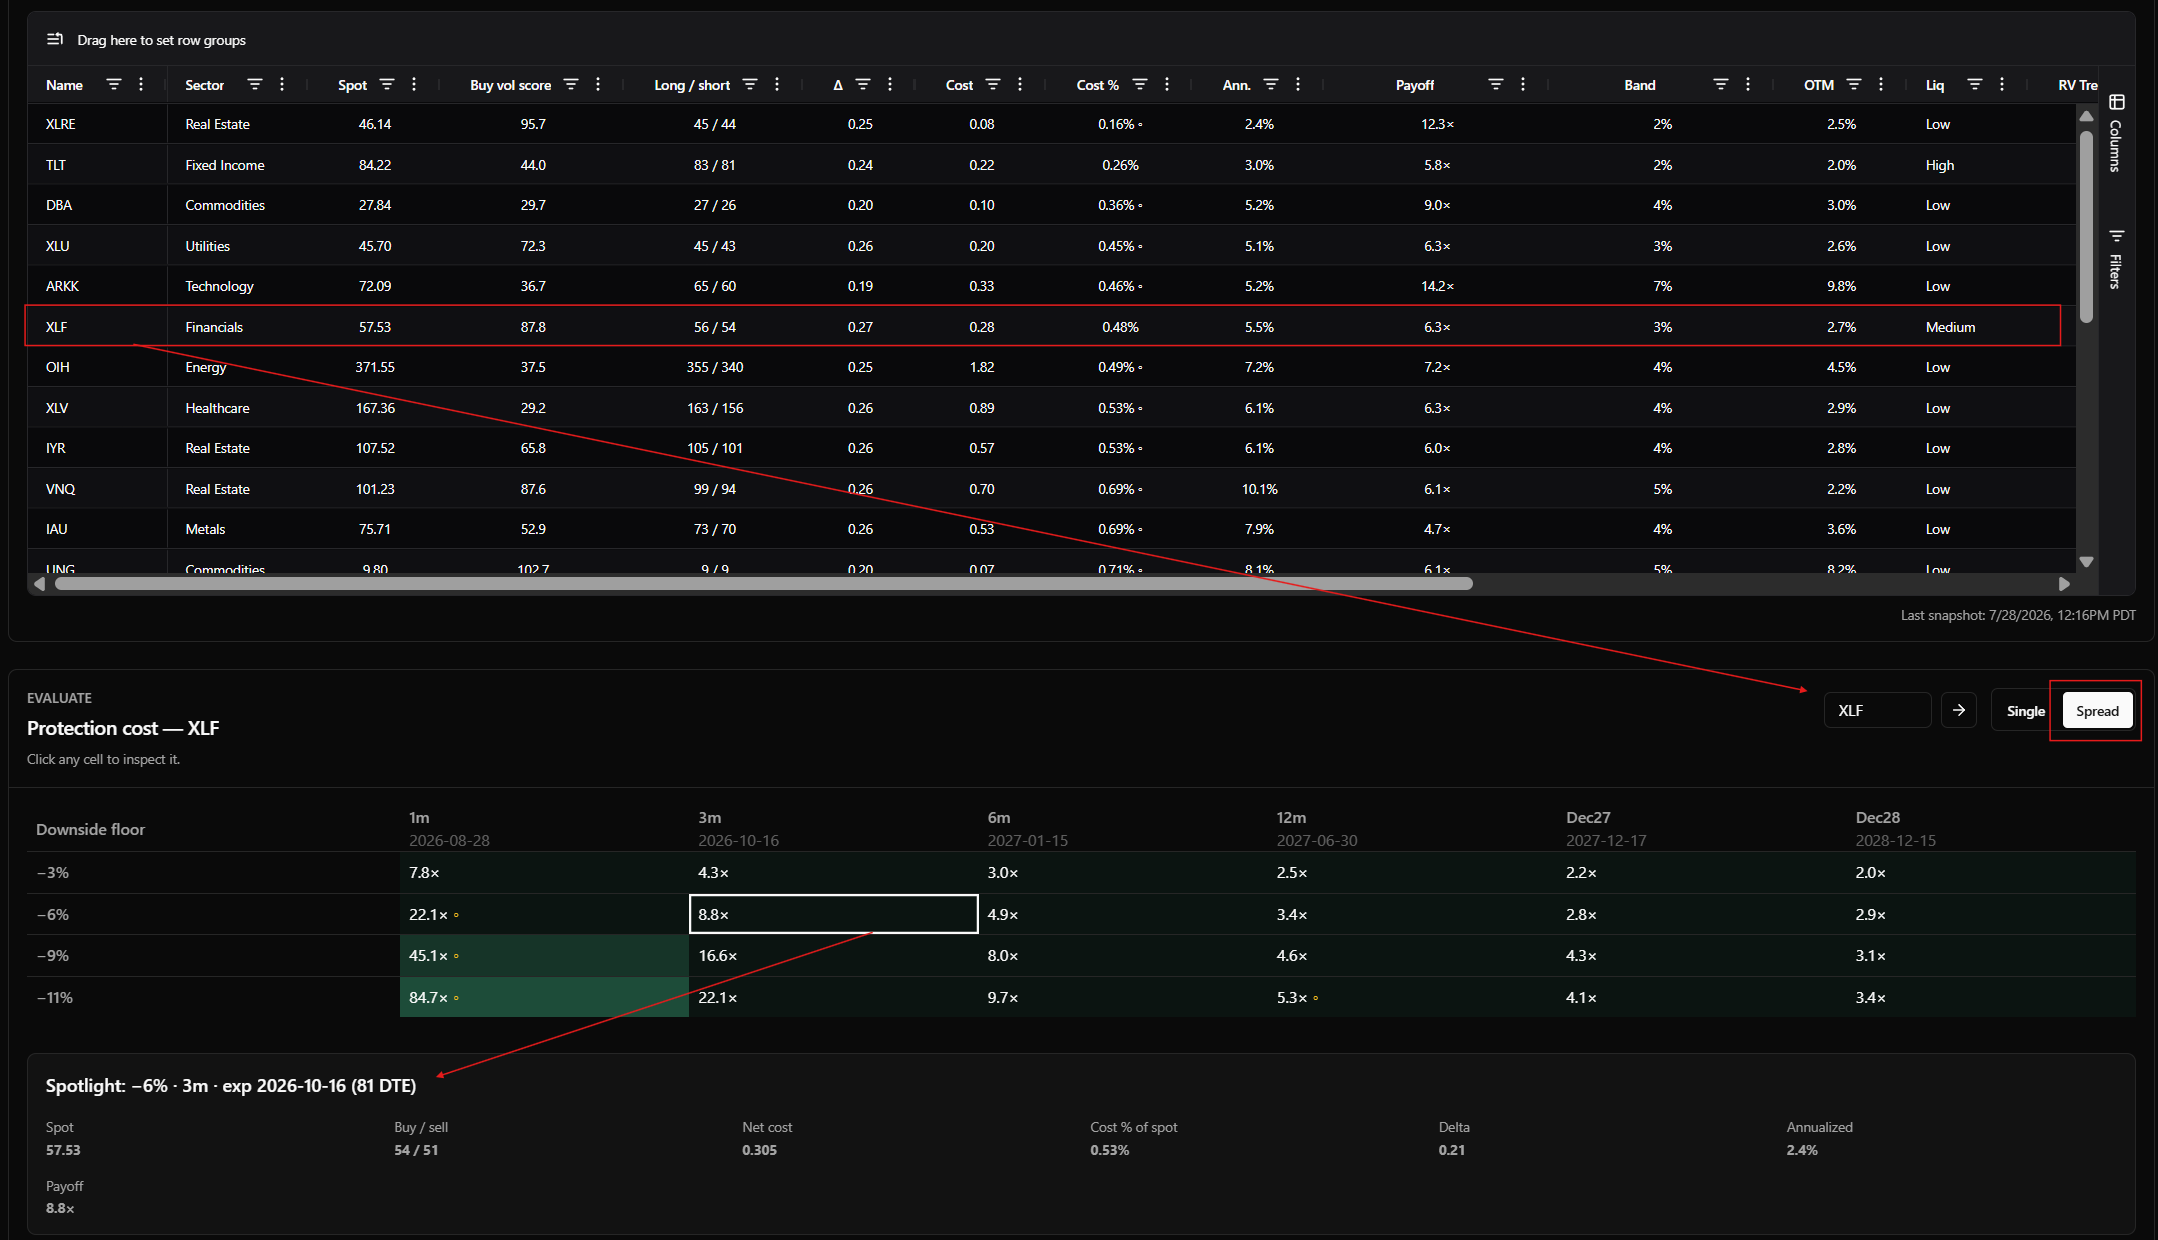
3. Evaluate — the cost menu
From the screener, click any cell to load it into the spotlight card underneath.
What the cells display depends on the structure. Single legs show cost, cheapest brightest. Spreads show payoff instead of cost. The headline card follows the same rule: lowest cost for singles, highest payoff for spreads.
The buy vol score
The screeners leverage our "Buy Vol" Scores using the same algorithm which ranks Moontower Trade Ideas, built from the same four inputs — implied vol, VRP, realized vol and term-structure steepness — but signed the other way, so cheaper vol scores higher. The Defensive Workflow marries investor intent with the "volatility lens" for distinguishing whether protection is genuinely cheap versus merely low-priced. The score conveys a sense of value.
Two properties matter here. It's cross-sectional: names are ranked against each other, not against an absolute standard. And it's recomputed against whatever is in scope — narrow the ticker list or tighten the liquidity filter and every score shifts. A score only means something next to the other scores currently on screen.
It's the X-axis on Discover and the primary sort in the Screener's Vol View, which makes it the natural starting axis: buy vol score against put skew, against IV percentile, against correlation.
Metrics specific to this tool
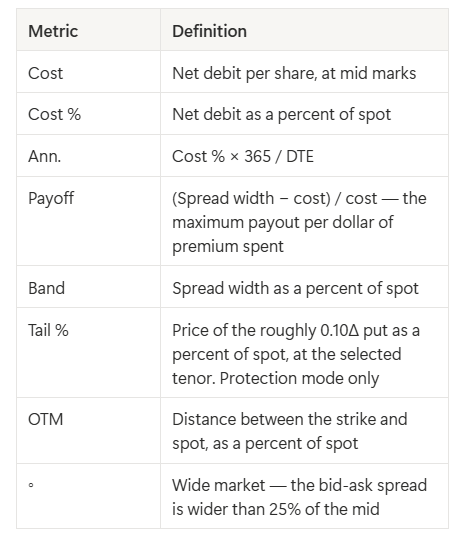
Everything else in the column roster — VRP, steepness, the IV and RV percentiles, RV trend, correlation to SPY, SD from 200MA, the weekly return and IV-change fields — is the same metric it is everywhere else in the app, carried here so you can build intersections without leaving the page.
Screening with the grid
- Filter on any column. Range filters on numbers, text filter on Name, checkbox filters on Sector and Liq. Filters stack.
- Group by any column by dragging its header into the group bar.
- Choose your columns from the Columns panel — every computed field is available, including both skew wings regardless of which side you're on. Switching between Protection and Replacement changes which skew shows by default, not which ones you can pick.
- Sort on anything, including columns you added.
- Save what you build. Name the current filters, sort, grouping, and columns and it comes back in one click. The same menu carries a set of read-only house screens we ship with the tool.
Choices persist between visits.
Example screens
The first two ship as house screens — pick one from the Screens menu and the filters, sort, and columns are set for you. The third you build yourself.
High-beta names where downside is cheap. Protection + Spread. Corr SPY (1M) > 0.7, IV %tile 1Y < 40, sort by Payoff descending. Exposure that moves with the market, where protection happens to be priced low against the name's own history — ranked by how much the spread pays per dollar spent. This is the screen that pairs with the Income tool's rich-call screen if you're financing protection with premium sold elsewhere in the book.
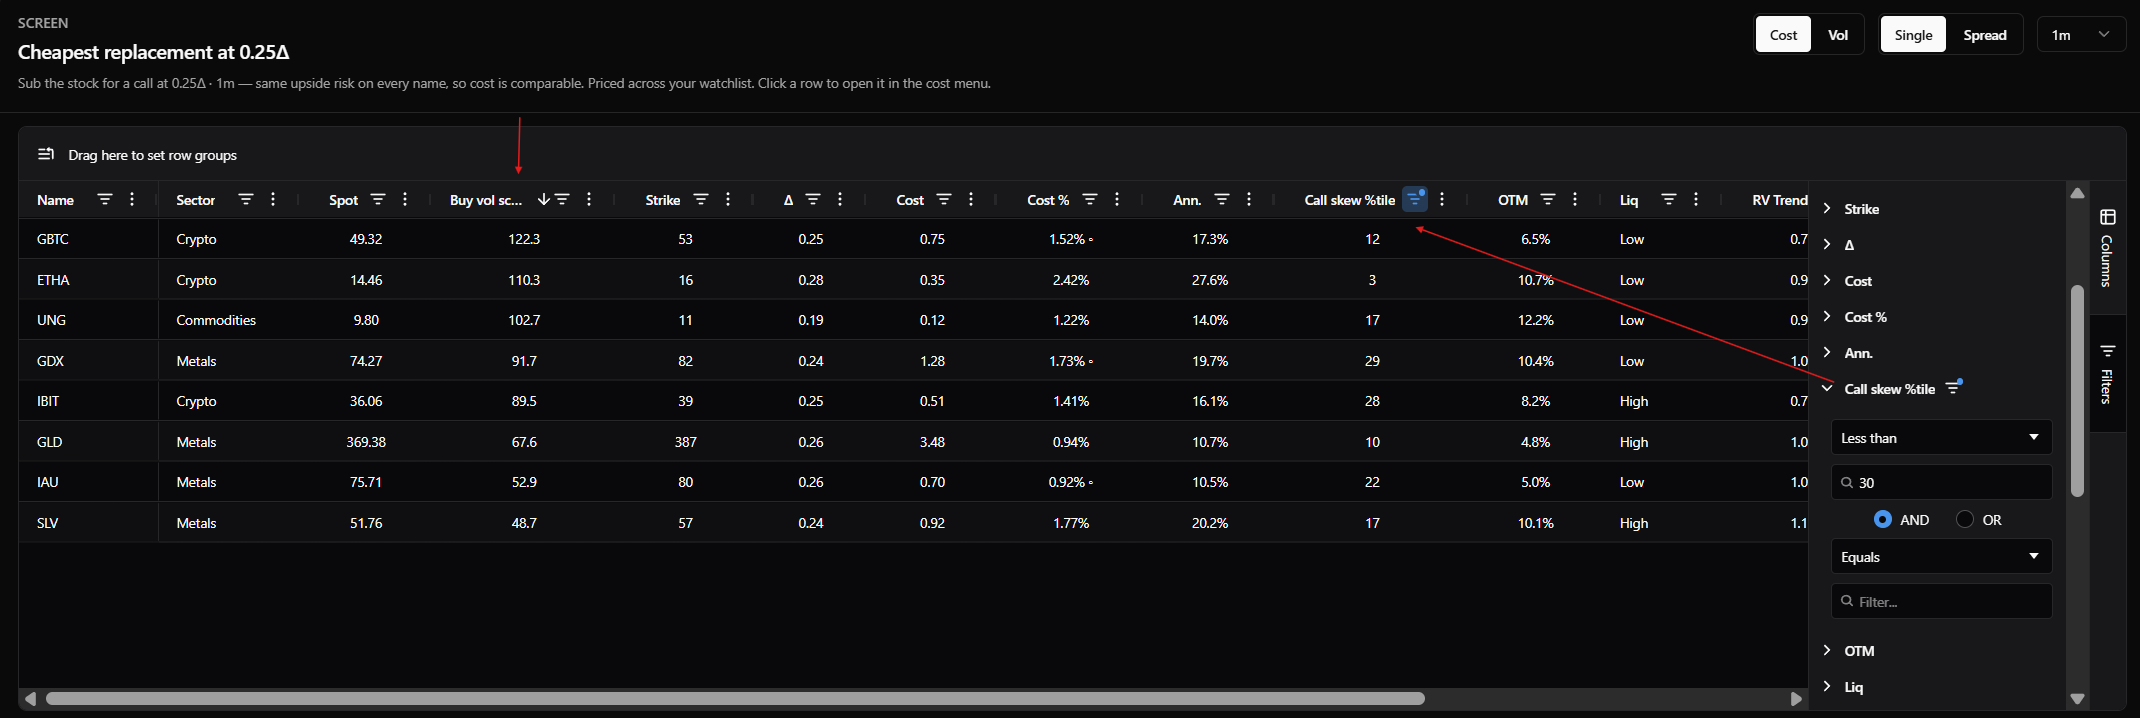
Cheap replacement, flat call wing. Replacement side. A high buy-vol score against a Call skew %tile below 30, sorted by Cost %. Names where swapping stock for a call costs least relative to the exposure it buys back.
Tail pricing by sector. Protection + Single, grouped by Sector, with Tail % showing. Compares what the far wing costs across groups rather than across single names — useful when you're deciding where a hedge budget goes rather than which name to hedge.