
what hides in the option chain
things to watch for in option chains
We’ve been talking about option funding stuff recently in the paid Thursday issues. Recently, I had a trader ask for some help making sense of an option expiry in a single name that trades by appointment but where some chunky size goes through.
It’s a name with lots of hair on it with respect to events and distribution.
[The current mark of a big option trade that went through a few weeks ago is still rattling in my head. I’m looking forward to where the roulette wheel is gonna land on this thing!]
I’m obviously not going to give away the name, but I can recycle some of what I explained to the client using a fake stock.
It’s rooted in funding and why understanding it is frankly critical for making sense of names that have wide markets. You’ll see :
- the first thing that caught my eye when I looked at the option chain
- put-call parity’s relationship to a vol curve
- how to avoid making really dumb trades (or if you’re a broker how to look like a hero to your client)
We can do this with screenshots and commentary to make this tour brisk but rich.
We begin with an invented option chain for our fake stock. I chose these values to be in keeping with the quality of the real stock’s markets without giving anything away.
For any junior traders or trainees this is good diagnostic practice — to eyeball an option chain and take notice of what’s interesting.
Relevant background info:
✅European-style expiry (it’s complicated enough without early exercise)
✅No dividends
✅RFR: 4%
✅DTE: 43
✅Stock price: $108.50
What do you notice:
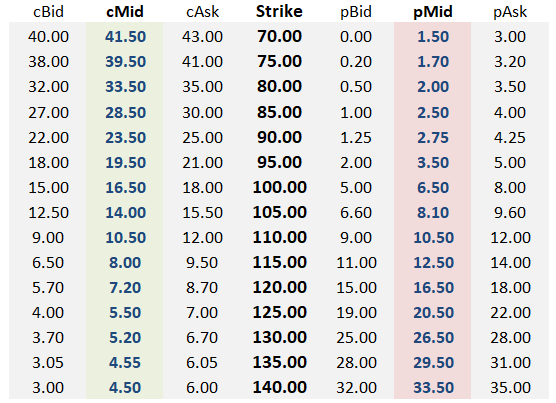
Don’t start all nerd mastermind. Instead observe. These markets are wide!
Well, before you start thinking “The 125/130/135 call fly is negative, yay free money”, you should recognize that the market widths are obscuring this vol surface. I mean, if you think you can trade at mid-market, there’s free money all over this board. All kinds of bells should be going off but just as a surgeon has a checklist, there is definitely a priority thing to look for.
Think a bit before I offer a hint.
Ok, here are 2 columns that should help:
IVM = “IV Mid”
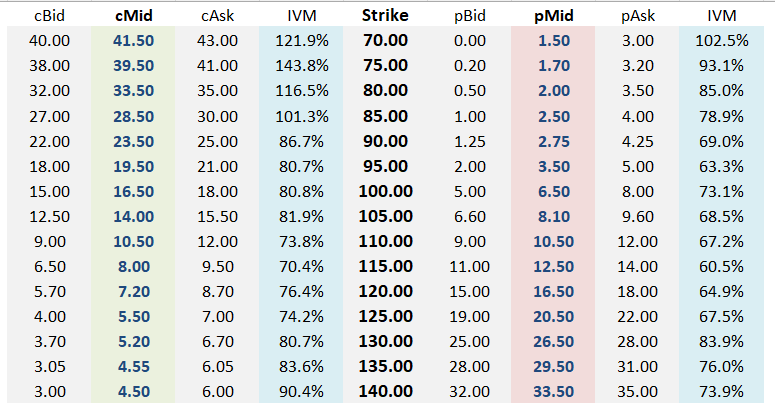
Categorically, the call IVs are greater than the put IVs on the same strike.
It’s safe to assume the stock is $108.50 as I indicated in the setup.
So what’s the likely culprit?
The rate.
We used RFR = 4% but with that rate put/call parity is not holding.
This is messy since we are using the mid of wide markets, but I didn’t contrive this situation from scratch— it is based on a real snapshot the client showed me on a screenshare, so it’s an opportunity to address real-world complications.
If call IVs is categorically higher than put IVs then the IV is being computed from a rate that is too low.
Instead of imposing a rate, let’s try something else. We will require that put/call parity hold at each strike.
💡Review the method: implying the cost of carry in options
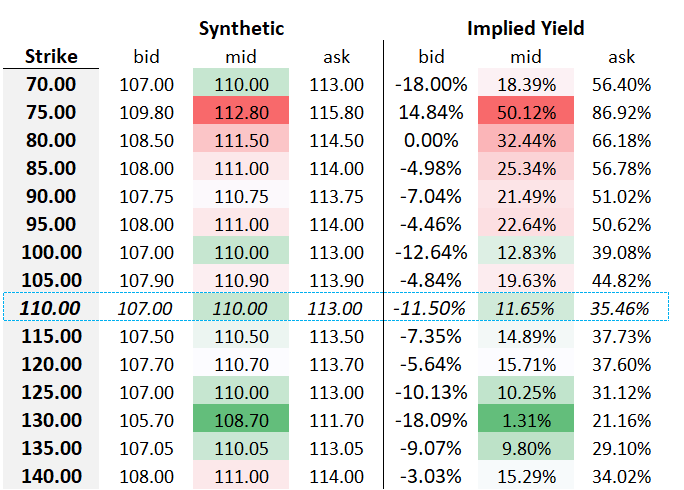
This table is a handy way to start:
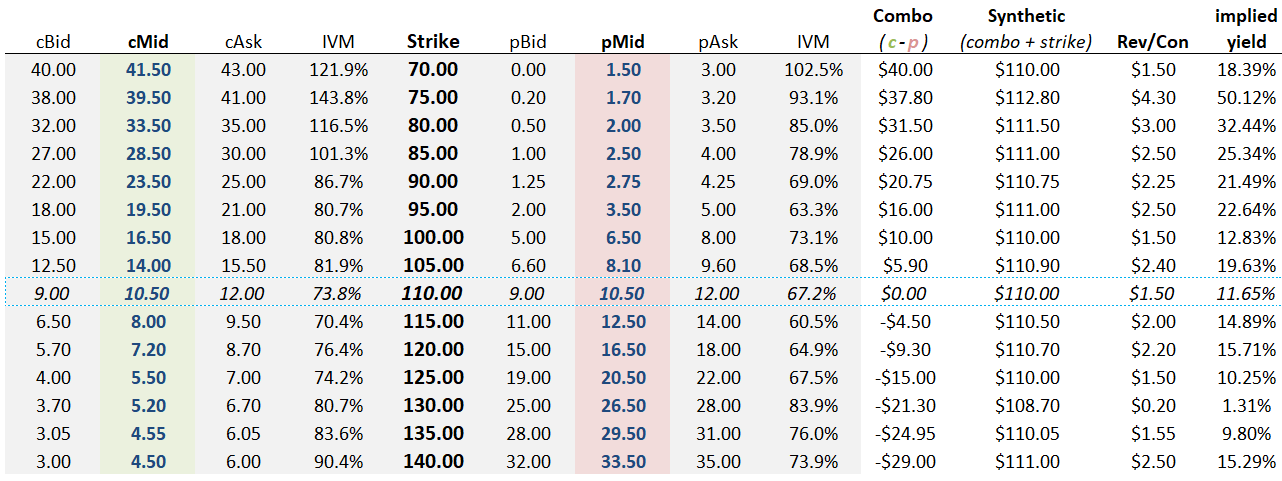
I highlighted the 110-strike because it’s closest to the $108.50 spot price.
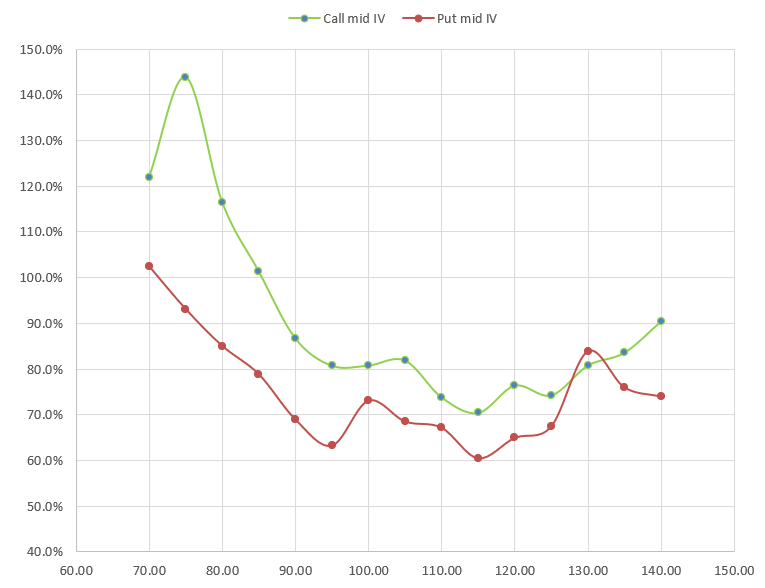
The right-most column shows the implied yield of each strike. By computing an implied yield the call and put IVs are forced to be the same but I left the stale ones in the table for the sake of this chart:
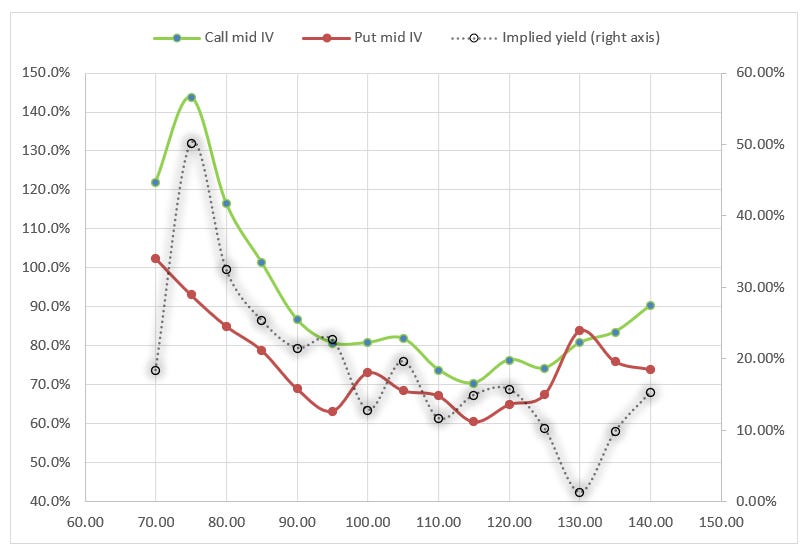
It demonstrates that a difference in call and put IVs is another way of saying the implied yield or cost of carry on each strike is different.
If you impose put/call parity, forcing the IVs on the strikes to be the same (I didn’t recompute the IVs on each strike here with the implied rates from their strike), then instead of seeing a chart with call and put IVs not lining up you’ll get some implied rate curve across strikes like you see here.
Let’s look at this like a checklist:
✔️If the call and put IVs differ across the strikes when imposing a cost-of-carry parameter (as we did with 4%) then the market is telling you your cost-of-carry parameter is wrong.
✔️Instead, impose a market-based yield by starting with the no-arbitrage assumption of put/call parity to get call and put IVs to line up.
✔️But if this leads to large disparities in implied rates across strikes, well, we still have a puzzle.
Looking at our rate curve…we still have a puzzle.
Experienced traders know why, but just to bring it along gradually, here’s another table that will look very familiar to anyone with an ETF, index, or options arbitrage background:
Computing the implied market by calculating the implied synthetic stock futures bid and offer.
Remember, the synthetic is just the combo price (c-p) plus the strike price. In the prior table we based our synthetic prices on the midmarket values of the options.
Here we want more detail. For each strike, we calculate:
synthetic bid = call bid - put offer
Take the 110-strike as an example to consider what this means…if you hit the screen bid on the calls AND simultaneously lifted the screen offer on the puts, effectively crossing 2 $3 wide markets (before you got fired), you have sold the synthetic future at $107.
We compute the implied yield bid/ask using the implied combo bid and offer with the same logic. [Again, to turn option combo prices into implied yields see this post.]
The puzzle as to why we are getting a ridiculous range of implied yields is not too mysterious — the markets are just too wide. Garbage.
We will do our best with what we have because there’s still plenty to see.
The art of computing the vol surface
The preferred way to set a vol curve is to imply the rate, then impose that on the surface to generate strike vols. Since the implied rate on each strike based on mid-market won’t be perfectly uniform (although likely much better than this stock) you will still get different call and put IVs on the same strike but they are not likely to “cross”. In other words, you won’t be able to lift a call option on a strike for a lower IV than you can sell on the put (or vice versa). The error in IV should be within the market widths.
To give you a flavor of how you impose an implied rate on the strikes across the same expiry we can consider a few methods.
The tightest market
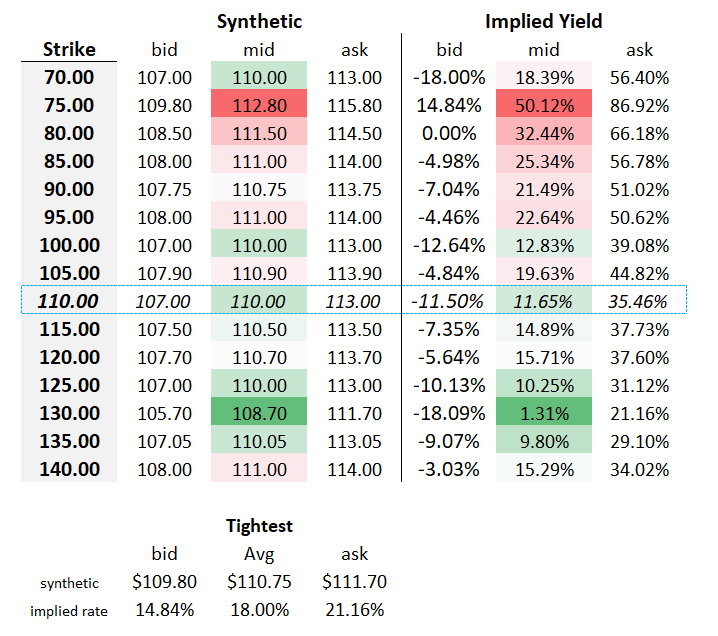
We cobble together the best bid and offer from any of the strikes to imply a yield. I don’t love this method for actually estimating the rate, but it’s the fastest way to spot an arb! Look at all the implied rates…the 75 strike really sticks out like sore thumb. If you hit the call bid and lift the put offer you have synthetically sold the stock at $109.80. If you buy the shares for $108.50, borrowing to finance them until expiry in 43 days, you will have legged a “conversion” trade for a fat profit.
Trader math — I borrow $108.50 for 2 months at 5% (notice conservative assumptions on both days and rate) that’s 1/6 * 5% or 80bps on $108…call it 90 cents. So I buy stock for $108.50, sell it at $109.80 and pay $.90 in interest…$.40 pure profit. Manage to get filled on 50 combos? That’s $2k in 2 seconds. Annualize that.
I’m getting carried away. This kinda thing is never just sitting there because it’s easy to program a bot to “eye” for it and then if it does find it, it’s because you ingested stale data. Still, I hope I conveyed the benefit of the “tightest market” method even if the benefit accrues to speed demons.
Weightings
How else can we find an implied rate to impose across all strikes? We could average the implied yields we find at each strike but give more weight to strikes with tighter markets (in this case, every market is $3 wide so the strikes would get equal weight and given the widths — still garbage).
We can just choose to look at a range of strikes near-the-money. We can weight their implied rates by inverse distance to the stock price. We can exponentially weight tight markets. We can draw hard cutoffs on strikes that exceed specified widths. You can use a solver across strikes but even then you probably filter the strikes according to criteria that come from experience.
[And when it comes to American options, may god have have mercy on our souls. The value of rev/cons can vary widely across strikes as the probability of early exercise differs. You are very much triangulating across several unknowns because the probability of an option being exercised also depends on its vol so you end up falling back on some ordinal relationships that bound early exercise relativity between strikes. In English, it’s easier to say relative things about early exercise adjustments to rev/cons than it is to absolutely value a rev/con. If there’s one area that even experienced traders trip up on its American options. Through the grapevine, from multiple sources, I’ve heard that one of the largest market makers in the biz lost a meaningful proportion of their annual profits because their mispricing of early exercise was exposed during the rate hikes in 2022.]
Anyway, there are enough choices involved that no 2 firms compute vol surfaces starting with implied rates in exactly the same way. There’s no benefit to bogging down on a specific method for this post so I’m just going to impose the 11.65% rate from the 110-strike and re-compute IVs.
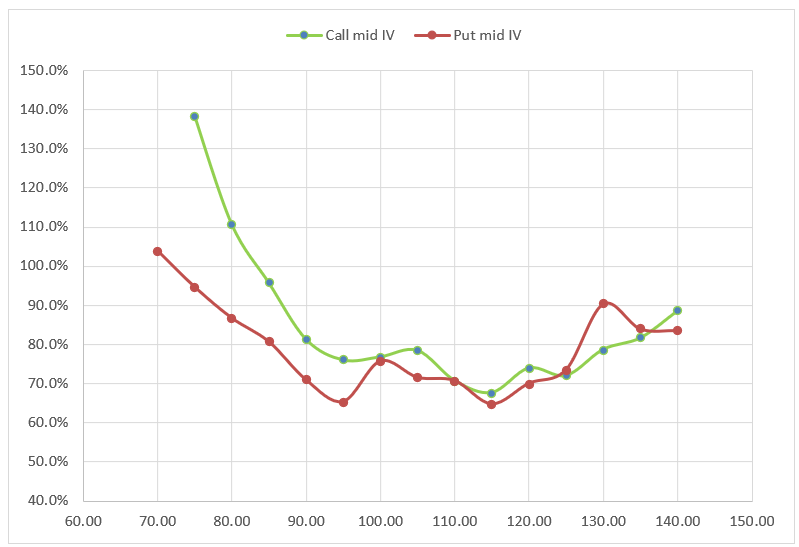
With the single rate, the call and put IVs come closer together especially for the near-the-money options. The deep OTM options are going to stay a problem because a $3 wide market on a .15 delta option is just a lot of vol points of noise. [The vega on those options is much smaller than ATM, so $3 represents more vol width.]
Towards a single vol curve
Usually when you look at a surface, it’s just a single vol curve through all the strikes for a given expiry. A common way to do this is to simply use the IV from the OTM option. That option tends to have a tighter bid/ask width since it has less delta risk for the quote streamer.
If you don’t want to dismiss all the information from the ITM option on the strike, you could weight the IV inversely to the market widths or even to the options’ contribution to the straddle price on the strike. Here’s the vol curves using the OTM method and the Inverse Contribution To Straddle method:
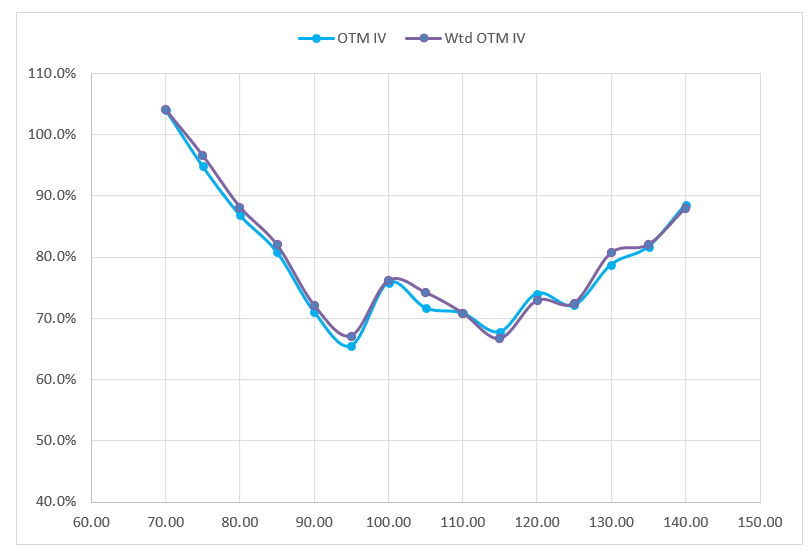
Looks like a “W”.
If you have been paying attention to all the stuff I’ve written about vertical spreads and butterflies, you can guess the implied distribution:
bimodal
And yes, the original stock I helped the client with does indeed look bimodal. This is also a distribution you often see on stock earnings.
[My group used to call it the “teepee” and I heard from some transplants that it was another famous market maker who made a lot of money “teaching” the market that this was the right shape for a vol surface in particular situations.]
While this fake stock is the spawn of a real bimodal stock, this is not the most interesting thing about the surface.
By far the most important thing to see is that the implied rates are totally jacked!!! The calls are leaned incredibly high relative to the puts. You have to be able to see this right away (or infer it from the call IVs being high relative to the put IVs if you use a platform that doesn’t impose put/call parity on ATM mid vols).
Calls should never be too high relative to puts because conversions are easy arbitrages especially in non-dividend-paying stocks.
[In conversion trades, you sell call, buy put, buy stock. You must fund the stock purchase so you are exposed to rising interest rates. But that is the only material risk.
Reversals which entail buying call, shorting puts and shorting stock are exposed to declining rates but also any suprise dividends or the stock becoming harder-to-borrow. That’s why you almost never see implied rates trade much higher than SOFR — it’s easy to arbitrage via conversions. But implied rates often trade far lower than SOFR because borrow is uncertain. If you do a reversal trade because you want to exploit the implied rate, your most likely outcome is to find out the rebate you anticipated on your short stock was wishful thinking].
What can you do if you notice the calls are too high relative to the puts?
The eager beaver is going to say “do a conversion arbitrage”. I appreciate the optimism. But those markets are wide. Those mid prices are fake. You can’t get filled anywhere near mid if you try to sell calls or buy puts.
But that’s the clue.
What do you do with the knowledge that the implied rate is too high if you can’t do conversion arbs?
You simply don’t buy calls or sell puts anywhere near mid-market. You are walking into a trap. If you are a broker or advising someone, you explain this to them as well. You’ll save them a bunch of money and they’ll appreciate that you know your stuff.
[This also helps manage expectations. If you are a broker and given an order to sell calls into this market, you should point out that the implied rates are high, meaning the calls are leaned up, and the customer shouldn’t expect to get filled near mid. Similarly, they wouldn’t be able to buy puts near mid either as those are leaned down.]
In closing, when you look at an option surface there are so many invisible decisions about how to compute the IVs. When you see call and put IVs that vary greatly, your instinct should be to imply the rate. This post has been in the recent tradition of “options are ALWAYS about vol EXCEPT when they are about funding” but I hope today’s effort has actually shown that we can’t actually compute the vols without understanding funding.
One of the funny things about options is that while variance is an abstract concept to trade (the square of standard deviation??) it’s a straightforward bet — the outcome of the trade is tied to the intent. The payoff reflects the expression. If the realized volatility will be low, sell this.
Meanwhile, listed options, literally called “vanilla”, these American-style shape shifters tradeable from your phone are a pile of path-dependent, hard-to-solve “halting” problems, being discussed by weekend-house-flipper salespeople because there are so many ways to win or lose that are unmoored to your original intent that the randomness of the experience makes them perfectly marketable despite their basics being inscrutable to their average user.
I hope this post made them a little less inscrutable to you.