
What Equity Option Traders Can Learn From Commodity Options
Lessons of markets that rhyme
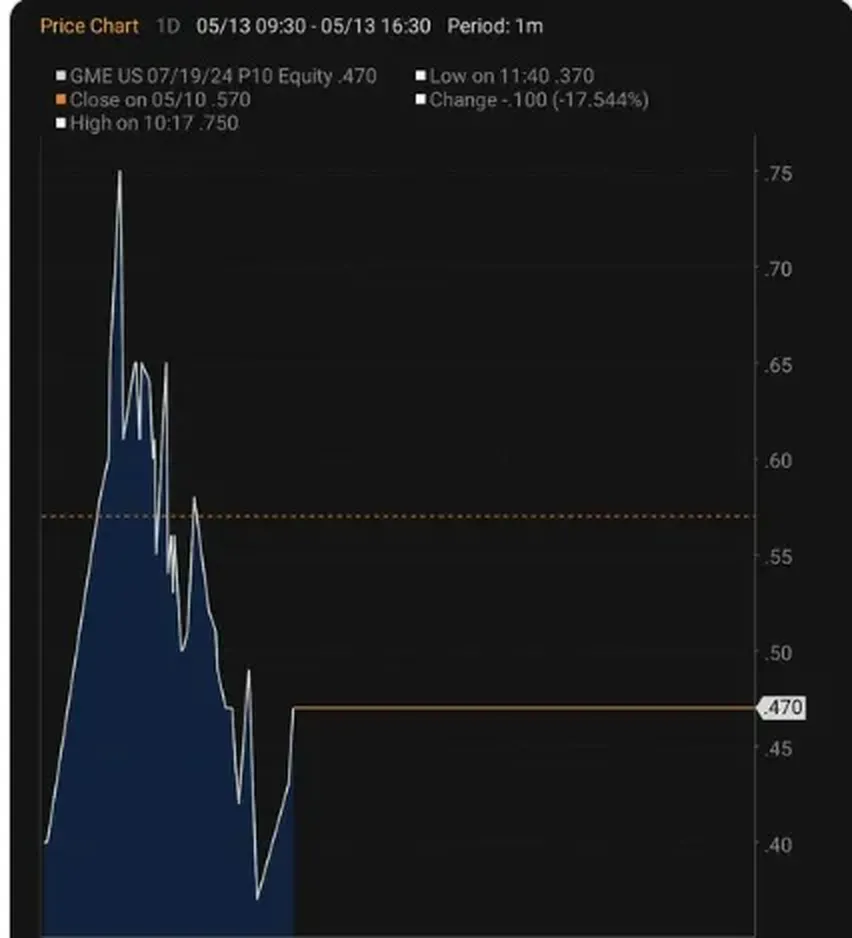
GME share price started the month around $11. On Friday May 10th, it closed $17.46. Monday it was about 80% to $31. Tuesday it climbed >50% closing at $48.75 before it would give back over half its gains just as quickly.
In a twitter thread @DeepDishEnjoyer, a former market-maker, called attention to what happened with the July expiry $10 strike put — despite a huge rally the put went up in value. Obviously implied volatility exploded.
Let’s follow along in the thread:
This is quite odd from a first principles perspective. GME closed 17 handle on Friday. Today it meme squeezed up because of Roaring Kitty. A basic model is: it continues meme’ing - then these puts expire worthless or the meme ends and we go back to where we were at at Friday. But note that you could have sold these puts at 75 cents today even though they closed in the 50s on Friday!!!! They should be actually be worth *less* since there is no state of the world where downside vol increased.
He continues:
That's easily anywhere from 20-40 cents of EV on these puts. And indeed that's where these puts landed now. So why does it happen? Well, market makers don't pay a large amount of attention to the wings of their vol surface. ATM implied vol got correctly bid, but they moved the...rest of the surface in parallel EVEN THOUGH THAT MAKES NO SENSE IN A SCENARIO WHERE A STOCK MEME GAPPED UP. Again, vol follows fairly two discrete paths that are intimately tied to stock price - vol is high when the stock is memeing, vol necessarily dies down when it stops.
At the money implied vol should increase. But the strike vol of the 10 strike put should not be massively increasing as the probability of going *below* 10 has not increased today from yesterday, while the options market is implying it has.
So did the IV on those puts go up “too much”?
Settle in. Lots to discuss.
I used the price chart of the put to price the options with a Black Scholes European-style calculator (the American/European thing isn’t important for this).
We start with May 10th just to establish the first elevated IV before stepping through the insanity of the May 13th morning.
It’s a bit hand-wavey since I didn’t know where the spot price was with every corresponding put price on that Monday morning. I assume the put price surged and eased while the spot price remains at $31. The illustration will be valid even if the exact numbers aren’t.
For the next section, keep in mind that N(d2) represents probability of option expiring in-the-money.
Stepping through the option prices…
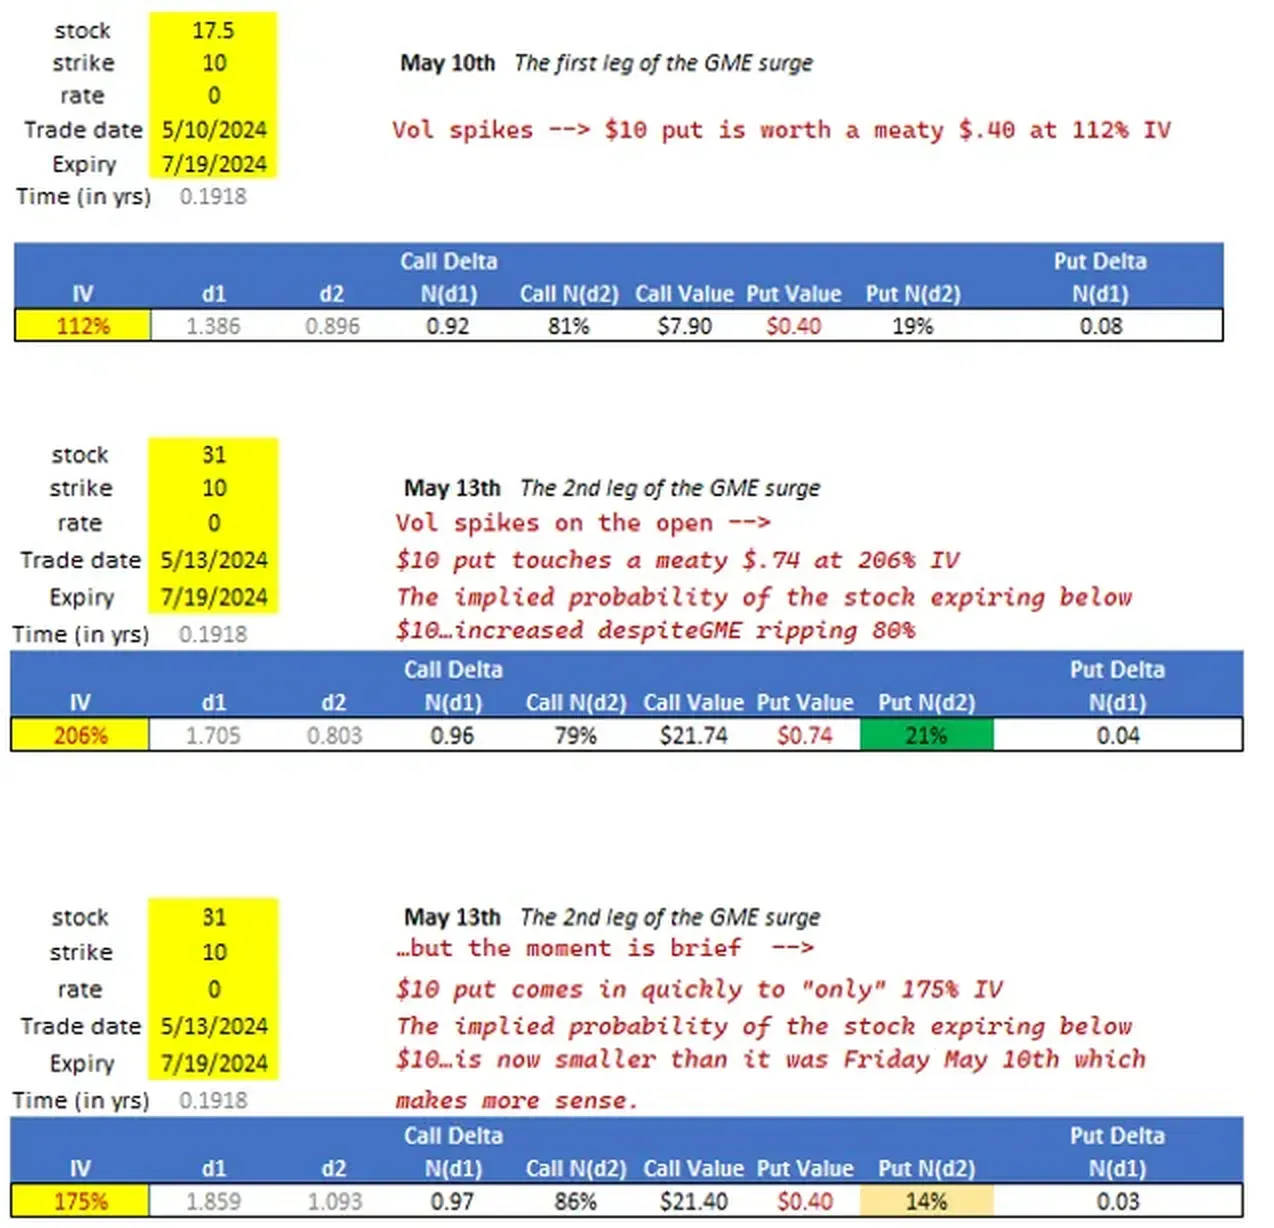
@DeepDishEnjoyer said at $.75 the put implied an even higher chance of going in the money with the stock at $31 than it did when the stock was $17.50.
That checks out in the option model.
It also reflects experienced intuition by DeepDishEnjoyer because I doubt he manually computed N(d2).
The option beginner could have exclaimed “the implied probability isn’t higher — the delta of the put went from .08 to .04!” If you’ve been at the moontower for awhile you understand in high volatility names delta does not equal probability (if you are a new reader then I point you to a top-5 most read post: Lessons From The .50 Delta Option).
When the vol eases back to 175%, still higher than the previous day but off the high, the put’s probability falls to 14% (and the delta falls meagerly from .04 to .03).
Our twitter friend used a sense of implied probability to conclude that the put price expanded too much. And because he says:
there’s easily anywhere from 20-40 cents of EV on these puts. And indeed that's where these puts landed now
I can infer that while he thought the $.75 price was too high, he may not have a strong opinion on the $.40 price. A price that still represents a much higher IV (175%) vs Friday (112%).
Smacks of a lot of experience. It was also a slightly different way than I would have thought about it.
How my instincts work in such situations
My reflex is also to think in terms of probability. However, I don’t reach for an N(d2) calculator.
I look at put spreads. Tradeable odds.
When DeepDishEnjoyer says the $.75 price is too high a probability, he’s collapsing a lot of compiled mental code into a comment. It’s worth unwrapping.
The price of an option reflects the probability of going in the money as well as how far ITM it can go. The divergence of the delta and N(d2) is model-based clue — since the maximum payoff on that put is capped at $10 then the exploding IV is mostly operating on the probability portion.
My native instinct when thinking about probability is to look at the put spreads since verticals are model-free over/under style bets.
See:
When I think “The $10 put is too high” I hear 2 possibilities:
a) The volatility is too high
or
b) There is a slab of put spreads on the surface that are too cheap where you should buy a higher strike put and sell the expensive $10 put. In this case, you believe the probability of finishing in the money for the $10 put is too high, but the implied probability of the stock going back to $10 is too low.
In other words, we get option trades ideas that are in opposition!
- If you believe volatility is too high you should consider selling at-the-money options which have more vega and at least locally less exposure to high-order moments. (Since the market is volatile, you might sell straddles, see the stock move, and your options become OTM, leaving you exposed to those higher-order moments anyway.)
- If you think the $10 put is too high, and buy a put spread because you think the implied probability of going to $10 is underpriced. But this is a long vol position.
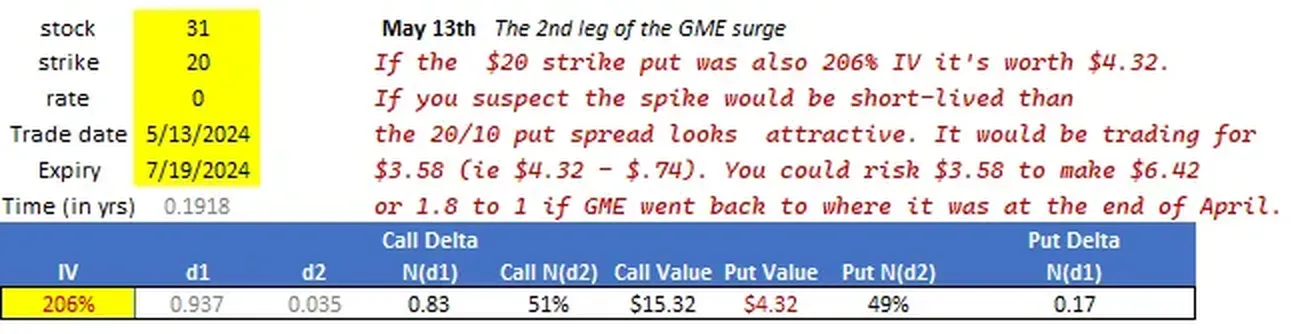
This is the $20 put if you priced it at 206% vol as well.
Notice how the probability of going ITM is 49% despite the strike being 33% out-of-the-money. Again, even though the probability looks high at nearly 50%, the delta is only .17
So how do we parse this?
We agree the $10 put is too high at $.75…do we sell it as the short leg of a put spread offering 1.8 to 1 on the meme situation ending by mid-July?
The price action looks like that $.75 print was fleeting and likely hard to get on. I doubt the market-makers mispriced it so much as recognized that buyers on a Monday morning could be sloppy traders thinking “I’m buying puts because this stock action is dumb” and were directionally aware but not vol aware. Rip the surface up, print the customers, take it back down to a spot that balances a more level-headed meeting price of buyers and sellers.
It’s hard to disagree with DeepDishEnjoyer. The puts were an outright sale. Probably hard to execute in the fleeting window but the point stands.
The way this situation unfolded, the speed of the rally, occurrence over a weekend, and retrace within a few days reminds me of early 2021 when SLV got aped from about $24 to $27 for a hot second.
The vols blew out across the surface (especially the calls) and I had exactly the same response as DeepDishEnjoyer -- sell the downside puts.
Unfortunately…
SLV did a great job pricing them. The best you could get on the 27/24 put spread was an even money payout on the stock retracing back to 24. Any "normal" surface would give you pretty nice odds of a stock falling 10% but the surface was telling you that a 10% sell-off was "home".
The put vols way underperformed the ATM and call vols. The market understood that those puts were trash and didn’t bid them up. Which made the put spreads, the structure you want to buy, a well-priced risk/reward. Nothing to see here.
The up move in SLV was not as extreme as GME. The vol expansion was only a doubling from about 35 to 70. So those OTM puts weren’t suddenly more expensive than they were pre-move. They just weren’t down as much as you’d expect.
If the stock went back down you would have lost on an unhedged basis. If were hedged then you risk the stock rallying further. And then if you did hedge and the stock fell what delta would you want to be short on? The p/l from a well-priced option trade is just path noise with no compensation.
Here’s a scenario any experienced option trader will relate to:
The stock sells off moderately, the vol comes in, which pushes that strike further OTM and the strike vol rolls up the skew curve as the option goes from say 20 delta to 5 delta despite becoming closer in moneyness. You’ll win on this move, but not as much as you’d like, and if you decide to cover the teeny put when you cover your stock shares you’ll pay a small exit tax on the way out. None of this will have felt worth the brain damage because the option market got it right from the start.
[There was a fleeting moment of edge in all this — there was a window of call buying at over 110% after the open that later settled in to being 90% IV for the next few days. If you missed that window, sure you could have sold 90% vol and thought that was high but you’re basically trading at fair value because there was liquid flow at both sides of that level.
Note the similarity to the GME puts. A fleeting window in the am before options settle into fair. The lesson — only trade a fast market on the open if you want to be a hero and willing to risk being a donkey. Unfortunately, getting filled is not a good sign. If you’d prefer a “fairer” execution you should wait.]
Commodity markets as teachers
I went for a hike during that SLV week with friend who runs a commodity vol fund. We had this moment:
“You wanted to buy put spreads and passed too?!”

We had the same instincts. And the same conclusion. Sell the puts, doh, they don’t look expensive compared to the rest of the surface, dammit, I hate this place.
We joked about how anyone who has ever traded nat gas has these same instincts. It can be April, gas futures for the upcoming Winter could be $8 and no matter which put spread you try to buy to bet gas goes right back to $3 by expiry pays no more than 3-to-1. If you have no frame of reference for odds…imagine being paid only 3-to-1 on a 63% selloff.
I’m looking at Jan25 options in ARKK right now. The 23/17 put spread costs about $.20 with the stock at $45. This spread can be worth $6. You’re getting 29-to-1 on a 63% selloff.
The other joke we made is that in commodities you find these regimes where wingy options just don’t change in price unless insanity happens. Your model says the option has a 5d but the experience is they behave on a 0 delta. This sound ridiculous until you watch people blow out because they have this wrong (nat gas is full of stories of people getting rinsed owning puts on massive selloffs including a large mm).
As a trader, when you see a crazy situation like a meme-stock, it’s useful to ask yourself — what market regularly has this behavior? Is it a market with lots of volume, a centralized/transparent order book, and 20+ years of institutionalized tacit knowledge of how to price options on such weirdness? Nat gas says “check, check and check”.
When a meme stock squeezes, does JANE SIGCIT just yell turn off “equity sheets run gas skew in GME?”
It’s not total overlap but a squeeze is balancing the same forces I explain in What The Widowmaker Can Teach Us About Trade Prospecting And Fool’s Gold:
The truth is the gas market is very smart. The options are priced in such a way that the path is highly respected. The OTM calls are jacked, because if we see H gas trade $10, the straddle will go nuclear.
Why? Because it has to balance 2 opposing forces.
- It’s not clear how high the price can go in a true squeeze or shortage
- The MOST likely scenario is the price collapses back to $3 or $4.
Let me repeat how gnarly this is.
The price has an unbounded upside, but it will most likely end up in the $3-$4 range.
Try to think of a strategy to trade that.
Good luck.
- Wanna trade verticals? You will find they all point right back to the $3 to $4 range.
- Upside butterflies which are the spread of call spreads (that’s not a typo…that’s what a fly is…a spread of spreads. Prove it to yourself with a pencil and paper) are zeros.
As a matter of prospecting, you can expect that each time a market starts “meme’ing” the playbooks become more obvious for the surface setters. That said, market-makers are exceptional pattern-matchers so if you have a reason why a familiar setup will have a different endpoint, you’ll be able to find great prices. But if you have the consensus “this thing is headed back home” view know that the prices already reflect that. You’re just tossing coins for even money.
GME was Groundhog’s Day. This is from the 2021 post How Options Confuse Directional Traders:
SLV downside
We’re going to come back to silver again in a moment.
In all this writing, I hope the message is coming across — you should not touch options if you have a directional opinion but not a vol opinion.
On Monday, we held the moontower.ai community zoom. We talked about the newly released Moontower Mission Plan series. The core goal of the series is to walk a user through the process of developing a volatility opinion (or “axe” as in “axe to grind” — trading lingo).
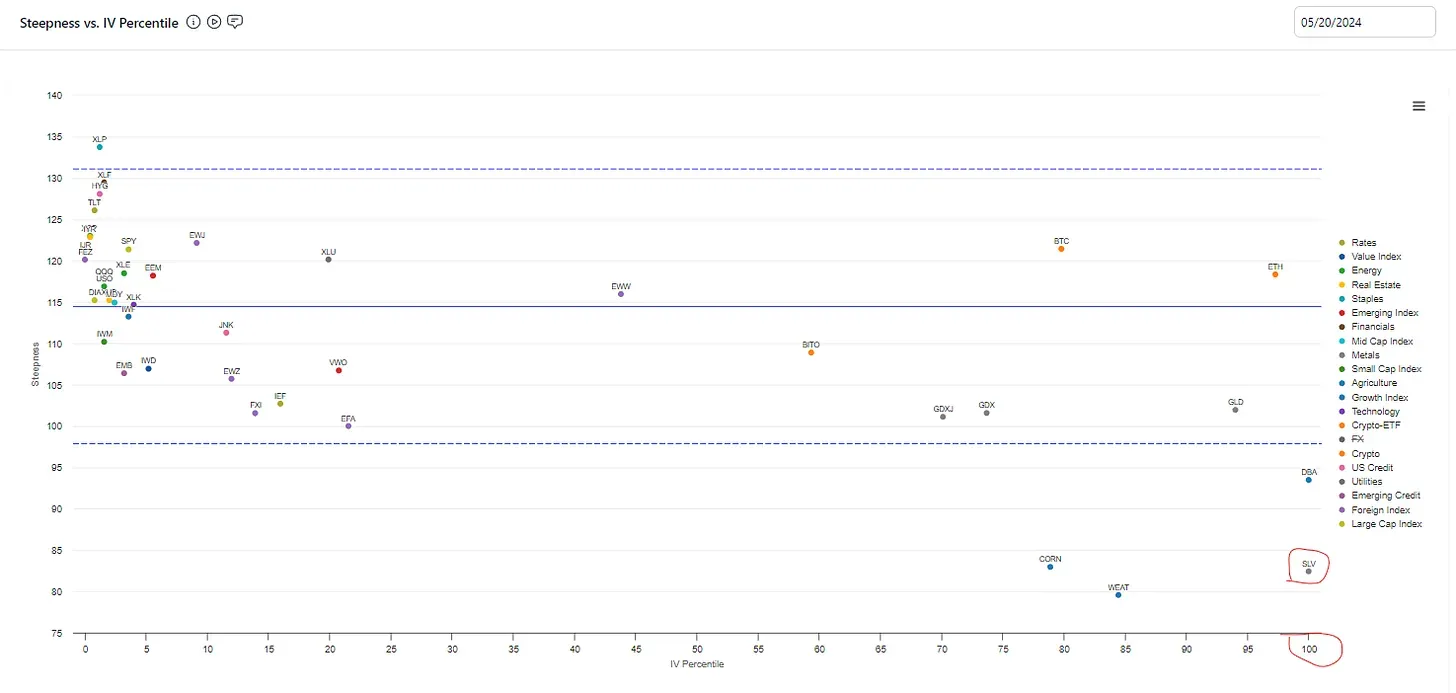
As we walked through the steps, I found that SLV near-dated downside (ie 1 month) looked like a sale.
The IV was elevated and the term structure strongly descending so we proposed selling near-dated…
…but then we check the VRP (volatility risk premium) to see how the IV looked compared to recent realized vol and found a healthy amount of carry.
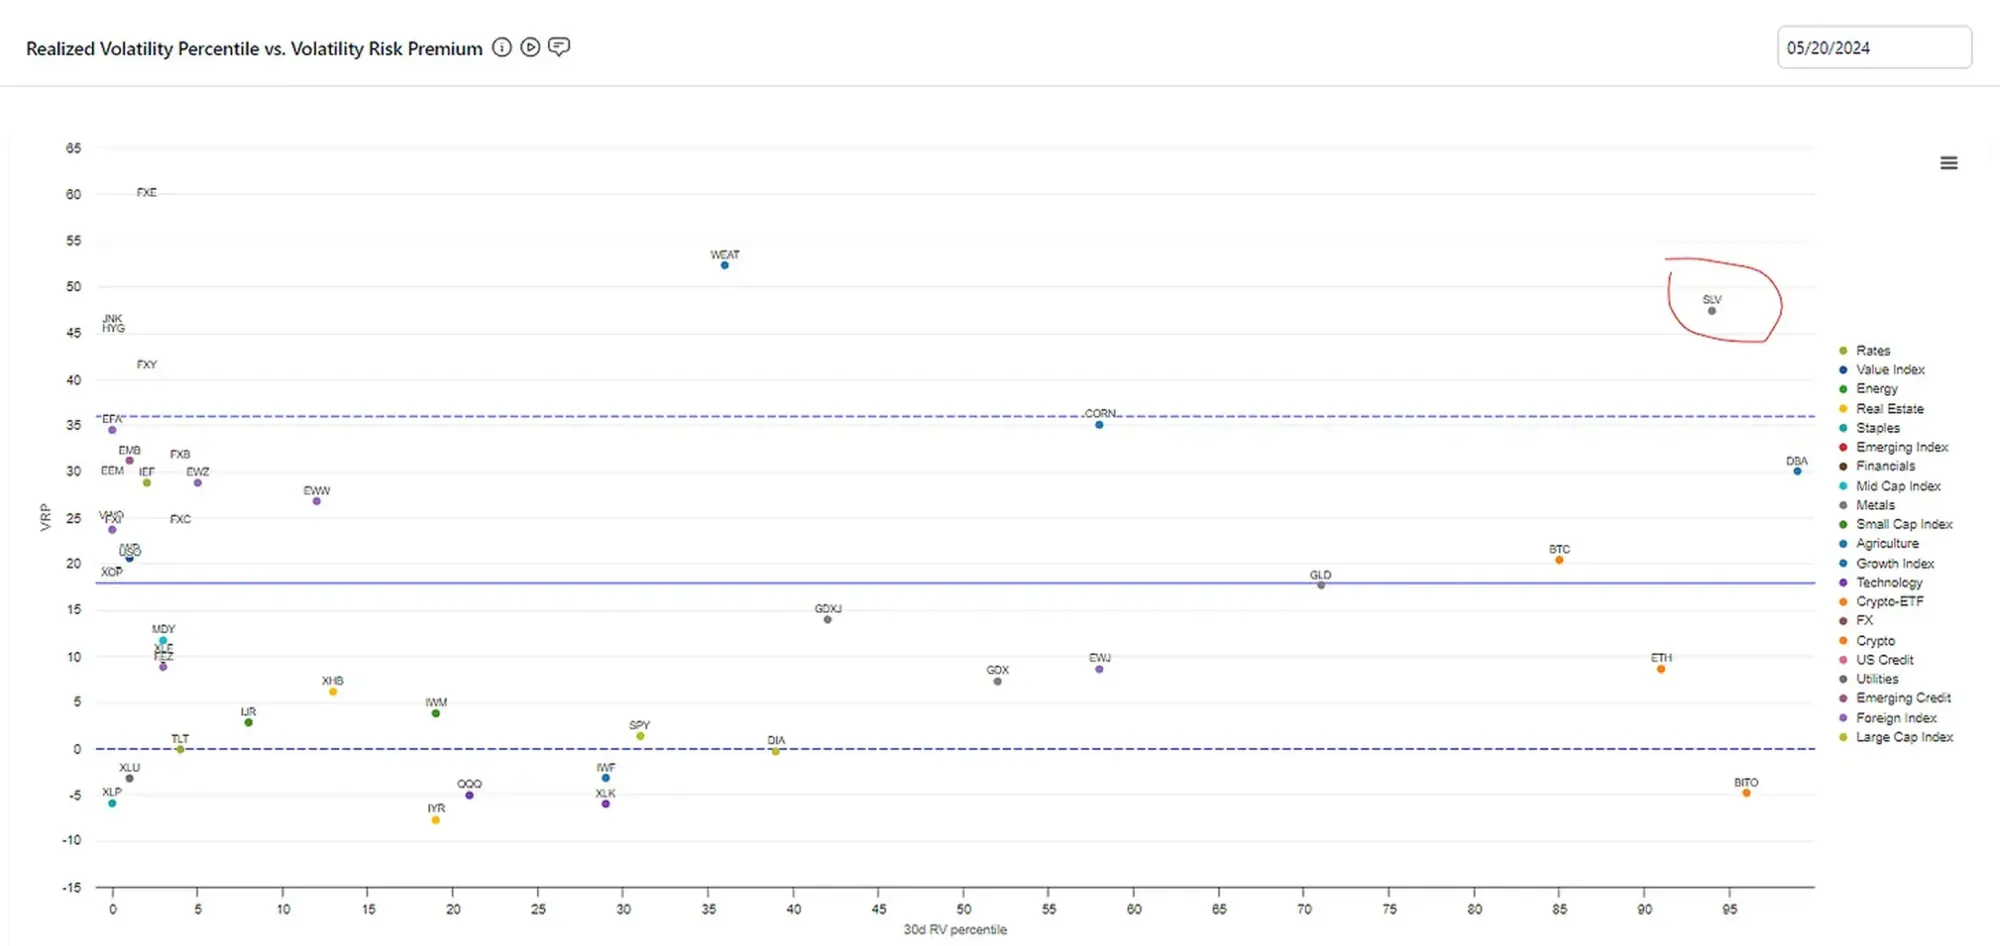
So we like selling near-dated SLV vol.
Now SLV has been rallying along with GLD. This thread by @SantiagoAuFund makes the case for a tactical short directional position in silver. The sentiment and COT positioning reasons are the ones that resonate most with me.
[Plus the fact that he’s being attacked for being bearish. I like when a trade offends people — if everyone is bulled up then the market is more likely to compensate the sellers since that’s whose service is needed. And if positioning indicates that speculators are already very long, then that’s embedded in the current price plus there’s less people left to buy. I hold no long term view on silver — I just like the tactical idea.]
Santiago expressed his bet via buying puts. This is where we differ. SLV vol looks like a sale so I want to express the bearish directional view in a short vol way. I also prefer simplicity. So I’d limit the trade expressions to:
- Selling ATM or ITM calls
The skew in the one month 25d puts according to our metrics is in the 47th percentile so it’s pretty fair therefore I don’t feel ripped off selling the ITM calls. (You could also sell the OTM puts and short the stock on a 1-1 ratio. It’s synthetically the same trade.) - Sell straddles where the call is ITM.
Same trade as the earlier one, but the initial delta is not as short (so if your directional conviction isn’t strong. Also if you sold OTM puts and hedge with half the number of shares this is synthetically an ITM straddle. The shares turn 1/2 the puts into synthetic calls. So if you sold 10 OTM puts and 500 shares your synthetically short 5 ITM straddles. Put-call parity is fun.) - You could sell the calls and cap your risk by buying an OTM call.
This is a short call spread. Since you are buying a higher strike call, your initial vega will not be as short. The wider the call spread the more the risk looks like a naked short call and the more short vol you are expressing (not to mention shorter deltas). - A more advanced trade could be to buy 1x2 put spreads
You could buy an ITM put to sell 2 OTM puts. You can find the strikes that dial in the desired initial delta and vega. But you can also see that this is the equivalent of buying a put spread and selling an extra OTM put. Or selling a straddle and buying a single OTM option to hedge. Options are Legos to build the structures you want, but just as a chess player chunks positions into familiar patterns, options can all be reduced to a combination of straddles and verticals (if we stick to a single expiry).
Ok, that’s enough for today.
Also, disclaim disclaim disclaim. You own your own decisions. I’m just saying what I see not recommending you do anything.