
weekend theta
understanding volatility time by zooming in on a weekend
The “weekend effect” in options refers to the tendency of implied vol to increase on Mondays.
Why does it happen?
First, perplexity.ai provides not only a decent start. In fact point #5 is quite impressive and clue-y.
The trading implication, point #6, is somewhere in between incomplete if you know what you’re talking about to dangerous if you are a novice reader. I’ll address later in the post.
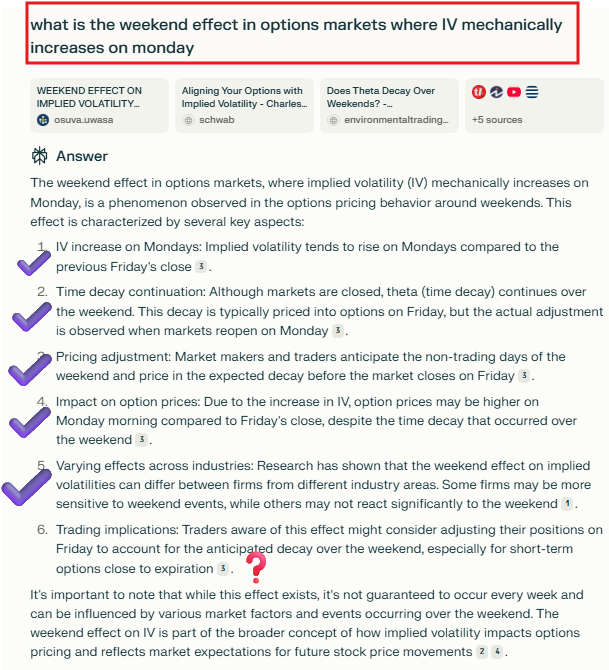
Perplexity does admirably but it doesn’t get to the core.
My condensed summary:
The weekend effect is a mathematical artifact that presents itself as “implied vol increases on Monday”.
Why?
Empirically, from Friday’s close until Monday’s open, options typically do not decay as much as the model’s theta would predict.
Therefore, to fit the the Monday a.m. option price, the implied vol must necessarily be higher than it was on Friday.
This post will explain why this is a mathematical artifact as opposed to a real change in the IV.
If the upward change in IV is an artifact, then does that suggest that an unchanged IV means vol is actually down?
Yep. Sure does.
Right now this tweet is a puzzler:
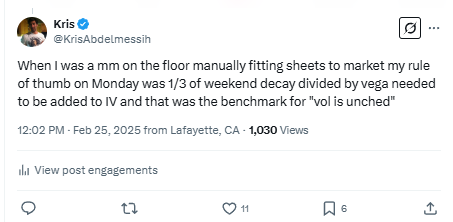
I’m going to explain it in detail.
And for your part, you’ll walk away understanding weekend theta and volatility time in a new way.
This post is going to get you over the line by zooming in on weekends in a basic way.
However, you could reconstruct all the ideas if you deeply understand this benchmark post:
In that post, we start high and you can use it pinpoint how to think about weekends.
In this treatment, we zoom in on a weekend and you could use that to scaffold your own construction of the high-level post.
Day counts
Conventional option models such as Black Scholes accept a days to expiry parameter. This input is represented as a fraction of a year.
When you encounter an option calculator in the wild, this fact is abstracted away. A calculator usually asks for a trade date and expiry date. If the trade date is March 1, 2025 and expiry is June 1, 2025 there is 92 DTE.
The model, if it uses a 365-day tenor, will convert 92 DTE to 92/365 = .252 years. This is known as a calendar day model.
You can have models that specify other tenors. A common variation is the business day model. It will have a 251-day tenor because it starts with 365 days but subtracts weekends and holidays (don’t forget Juneteenth).
From March 1 to June 1 there are 63 business days. DTE for that model is 63/251 = .251
There is slighty more DTE in the calendar day model than the business day model. Therefore, for a given option price, the calendar day model will have a slightly lower implied vol than the business day model. After all, both models are looking at the same option price but the first model thinks there’s more time to expiry.
On January 1, there is 1 year to expiry (365/365 or 251/251) for both models. But as soon as the clock starts ticking, the DTE between the 2 models diverges. The divergence depends on the ratio of business to non-business days until expiry.
How much time has elapsed?
Armed with this knowledge, let’s measure how much time has elapsed from Friday’s close to Monday’s close.
1. Calendar day model
3 days have elapsed.
Friday pm to Saturday pm, Saturday pm to Sunday pm, Sunday pm to Monday pm
Using the calendar day tenor, 3/365 or .82% of a year has elapsed.
2. Business day model
1 day has elapsed.
From Friday pm until Monday pm is just 1 business day.
Using the business day tenor, 1/251 or .40% or half as much time as the calendar day model!
Therefore from Friday’s close to Monday’s close, relative to a business day model, a calendar day IV will need to be ratcheted higher.
Relativity
What’s more “correct”, a calendar day model or business day model?
Wrong question.
There is no “correct”.
Consider what we know.
- Most conventional models use a 365-day tenor. The VIX calculation, the representation IV most broadly tracked, uses a 365-day tenor.
- Market observers are so used to seeing IV increase on Monday that they give it the name “weekend effect”
I’ll let you think about it. Based on the comparison with a 251-day model can you explain the effect?
Ok.
Here’s the logic…relative to a 251-day model, a conventional calendar day model must see its IV increase on Mondays. If this is a recurring trend, we should deduce that the market’s consensus is not decaying the options as much as the 365-day model predicts. The market’s pricing behavior strongly suggests that it believes time passes more slowly over a weekend.
I used the 251-day model to be extreme. The 251-day model assumes time doesn’t pass at all over a weekend. Time did not tick until Monday transpired. From Friday to Monday’s close it thinks 1/2 as much time to expiry elapsed.
It’s not that the market uses a different model. The market is not a monolithic entity with one model setting option prices. Consensus does. And the sum of everyone’s opinion suggests that time passes more slowly over a weekend than calendar models predict.
You can also appreciate this by inversion.
If you use a business-day model the weekend effect is inverted…IV looks like it falls on Mondays!
It makes sense.
The 251-day model thinks no theta happens on the weekend days, so the fact that option prices are lower on Monday am than Friday pm makes their model think that IV must have fallen.
It seems like we have a 2-sided market.
A Saturday is neither a full trading day or a zero. It’s worth something between 0 and 1 day.
Split the difference
What if I say that weekends and holidays are half days? Said otherwise, variance time passes 1/2 as fast.
If we continue to denominate our basic unit, a full trading day, as 1.0 and weekend days or holidays as .5 we get the following tenor:
251 x 1.0 + 114 * .5 = 308
We have a 308-day model that decays days at different rates.
When a Tuesday rolls off the calendar 1/308 or .3% of a year elpased.
When a Sunday peels off, .5/308 or .15% of year elapsed.
Turns out if you use a calendar like this, weekend effects are dampened. Which means your model is decaying time closer to the market’s consensus. The IVs in your model need less adjustment to match the market.
Overnight
We need to talk about one more topic before I can explain the tweet above.
It starts with a question.
In a calendar day model, how much time has elapsed from say Thursday’s close until Friday’s open? In “wall” or clock time it’s 4pm est to 9:30am est or 17.5 hours.
But if time passes slower on a weekend, it’s reasonable to assume time passes slower overnight if we start getting to the hour level. After all, I don’t think 17.5/24 or 73% of an option’s daily decay occurs just as the market opens.
If we define 1 day as close-to-close then we need to defined close-to-open as some proportion of 1 and 73% sounds way too high.
The US is the last market to open after Asia and Europe so it’s reasonable to assume that the overnight includes more than zero volatility (in the spirit of “if a tree falls in a forest”, even if the US was the first to open the overnight would be worth more than 0. The world happens when the market is closed. At the very least BTC volatility could be used as a ruler to measure with).
You could do a big study where you measure the ratio of close-to-open variance to close-to-close variance but for the purpose of this post I’ll use .25. It’s in the right ballpark.
Back to our question: how much time has elapsed from say Thursday’s close until Friday’s open?
.25
How much time elapses from Friday’s close to Monday’s open?
Friday PM to Sunday PM = 2
Sunday PM to Monday AM = .25
2.25 days elapse from Friday PM to Monday AM in our calendar day model.
How about in a 308-day model?
Friday PM to Saturday PM = .5
Saturday PM to Sunday PM = .5
Sunday PM to Monday AM = .25
1.25 days elapse from Friday PM to Monday AM in our 308-day model.
Explaining the tweet
Translating:
- On the floor I used a 365-day calendar model.
- On Monday, the market seemed to only decay the options by 2/3 of what my model theta expected.
- If I divide 1/3 the model’s theta for the weekend by the option vega that translates cents to vol points. Raising the vol in my model by that many vol points usually fit the market.
- I would think of that as my benchmark for “vol is unchanged”. Differences in IV from that benchmark would be interpreted as “change in vol”
Measuring vol in this way means “vol does not structurally go up on Mondays” which makes sense. It probably doesn’t. It only looks like it does if your measuring stick assumes time passes as quickly on non-market days as business days.
Again, from Friday PM to Monday AM:
🕛Calendar day model: 2.25/365 or .6% of a year elapses
🕛Blended 308-day model: 1.25/308 or .4% of year elapses
The blended model says time passes at 2/3 the rate of the calendar day model.
Hence adding back 1/3 of the theta in vol points seems to line up well with assumptions of overnight .25 and weekend days being .5 each (inclusive of the overnight, just as 1 business day is inclusive of .25 overnight).
[Weekend is .5 weight but made up of weekend day .25 and overnight .25. You could argue weekend overnights are worth less because foreign markets are also closed, but since .5 seems to align with how much I’d have to adjust vols it's a fine assumption even if I'm attributing the overnight and weekend day incorrectly. Hand-waving the deomposition would be a problem if I had to price an option on a Saturday.]
Bringing it altogether in an illustration
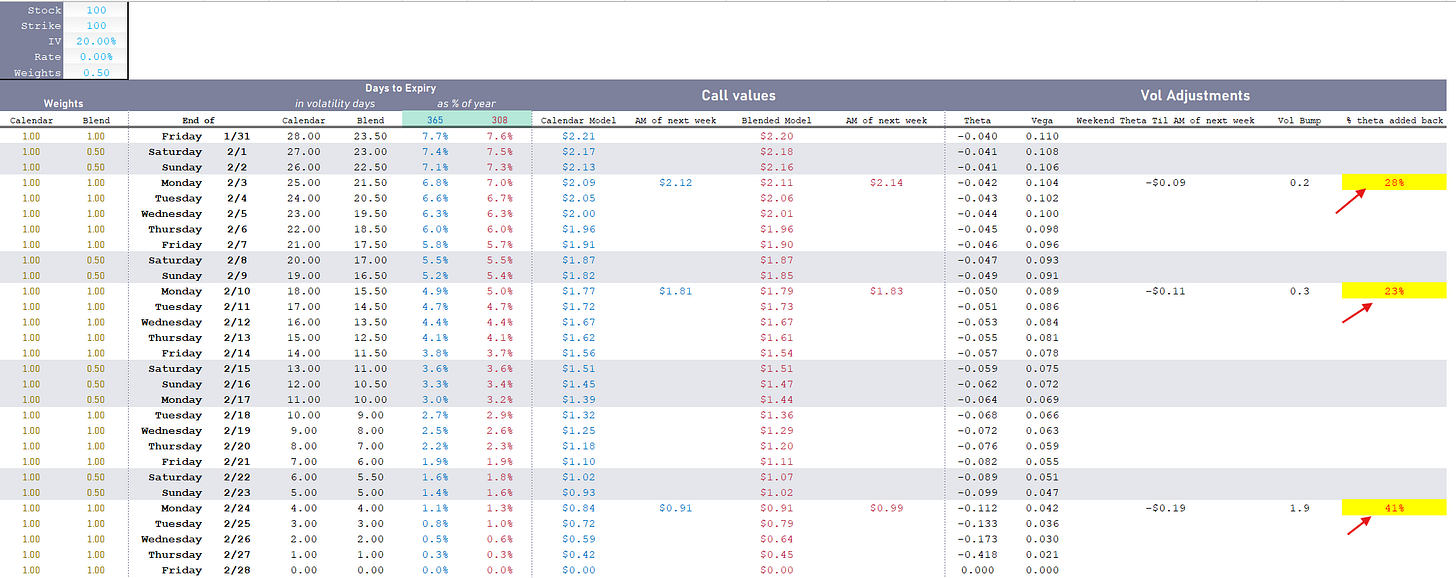
The percent of theta added back is in the ballpark of 1/3 depending on DTE but if you look at the error in vol points, it’s quite small (10% of 10 cents theta is a penny…for an option with 8 cents of vega this is .12 of a vol point).
Wrapping up
I’ll leave you with an assortment of considerations:
- If you are comparing IVs on assets with the same schedule the biases “cancel out”. Who cares if you are looking at relative vols and everything is biased high or low proportionally? This is the case for many option users. In other words, for almost everyone you can ignore this knowledge.
- (But moontower is written for an audience over a wide range so many of you will care and then there’s all the readers who just like weird technical stuff. And vol-time relativity is as worthy a nerd-snipe as anything else yea?)
- If you trade options on different expiry calendars (for example a USO option vs a oil futures option) then these differences will distort the IV spreads you’re observing.
- The distortions are amplified as event vols are incorporated into differing expiry calendars or am vs pm expirations.
- This matters far more for nearer dated options (ie < 1 month).
- Notice how I measured days from PM to PM. This is an artifact of working backwards from the expiration time which is typically after the close. But the more granular you get, the more the meaning of “when does this option actually expire?” matter. Can you contrary exercise? Does your broker have an earlier or later cutoff than other brokers. If AAPL pins on expiration but the index futures dive on geopolitical news after the close, then you would abandon any long calls on the pinned strike, exercise puts…or if you are short options on the strike expect to be stuffed with APPL shares by your counterparty. In other words, there is optionality after 4pm est.
- Spicier take: Trump having an interest in the assets open all weekend has implications for how fast time passes over the weekend. If weekends have more volatility, you’ll notice it in more decay transpiring from Friday to Monday. Unlike that last perplexity.ai bulletpoint’s assumption, this is not free money. The weekend gaps are larger (ie Friday pm to Monday am variance as a percent of Friday pm to Monday pm variance increases).