
Volatility term structure from multiple angles (part 2)
Term Structure part 2
In part 1 of Volatility term structure from multiple angles we opened by discussing how nearer dated implied vols move around more than deferred implieds. Recognizing that dynamic, our net vega position for a time spread can be ambiguous.
Just as stock traders use beta to normalize risk to a benchmark such as SPX, volatility traders will normalize their vega to a fulcrum month. √t scaling corresponds to a model world where time spreads between months remain relatively stable. It’s not reality but it’s a vast improvement over summing raw vegas.
In comparing vols between 2 months, vol ratios are popular. If M1 is 18% vol and M6 is 20%, the vol ratio is 90%. It’s a measure of how steep the term structure is. If you track the ratio for constant maturities then you can get a quick sense of the relative supply/demand for IV. If the ratio is less than 1.0, the term structure is ascending, a shape typical of “it’s quiet now, but we expect mean reversion to typical higher levels of vol”. A downward sloping vol curve is more closely associated with high vol periods or the market’s anticipation of an even such as earnings or the election.
Vol ratios are only one way to measure the slope of the term structure. We saw that implied forward vols are a complementary measure that also describes the relationship between 2 volatilities on the term structure. The computation tells what volatility is baked into the period between the 2 expirations. The logic is that the deferred expiration accounts for all the volatility from now until the option’s last trading date while the near-dated expiry isolates the early period’s expiration. If you consider an extreme example where the time spread is worth 0, ie the deferred option and the nearer-dated option are the same price, the forward vol is zero.
So why look at 2 measures, vol ratio and implied forward vol, if they both tell us about the relative price of implied vol on the term structure?
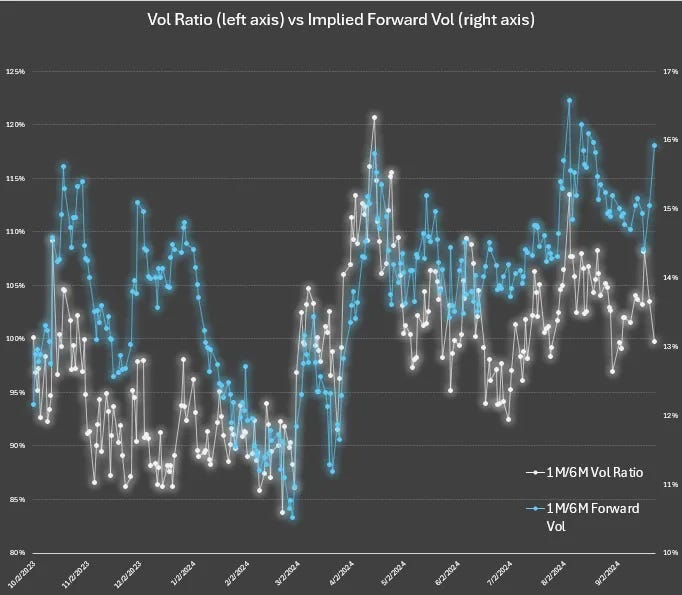
Remember, we were looking at GLD 1m/6M vols for the 1-year range 10/2/23-9/23/24:
We saw:
The forward vol is sometimes high and sometimes low regardless of the ratio!
But look at early March — not only was the vol ratio low, the forward got crushed. If you only look at vol ratio, you missed this.
Implied forwards are an orthogonal or complementary measure of relative volatility that is additive to your perspective.
Today, we will dive further into the relationship between vol scaling, forward vols, ratios. We will come out on the other side with what this all means for finding trades and managing risk.
Off we go…
Constant Straddle Spread vs Forward Vol
Suppose you are long a time spread.
We’ll say a straddle spread because that’s a common trade expression and it also connotes delta-neutrality.
[It’s probably helpful in thinking about these things to not have to process “call”, “put”, and their associated directionality. Depending on where you are in your learning I’m trying to be mindful of cognitive load.]
You’re long a 6-month straddle for 15% vol and short the 1-month straddle at 15% vol. Front month vol suddenly spikes a point to 16% and the 6-month vol increases by 1/√t (ie 1/√6) or .41 vol points to 15.41%
Here’s what we know:
- The term structure went from flat to descending.
- You lost 1 vol point on your 1-month straddle, gained .41 on your 6-month straddle. Because the 6-month straddle has 2.45x as much vega, you broke even.
- The straddle spread is unchanged.
What happened to the forward vol?
You can compute it yourself with the moontower calculator but I’ll just tell you…the implied forward vol increased to 15.3%
Let’s summarize what happened:
- You are long raw “click” vega since you own the longer-dated option
- You are flat weighted or scaled vega if we use √t scaling with reference to M1
- Vol across the curve increased in proportion to √t weights leaving the straddle spread unchanged
- The forward vol you are long increased, although your p/l is unchanged.
The key point to appreciate:
A constant straddle spread price does NOT mean the forward vols are also constant.
Another way to say this:
The same straddle spread price can yield different implied forwards!
Implied Forward Vol: a “many-to-one” relationship
For any implied forward vol there are many pairs of vols that can produce it. This is why the straddle spread and forward are not overlapping measures of term structure.
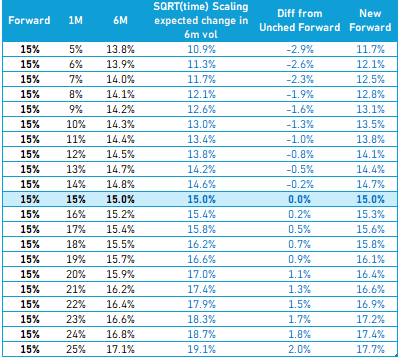
The table shows:
- many combinations of vols that generate a 15% forward
- √t or constant straddle spread scaling means the forward is changing
- The scaling would need to be sub √t (ie more muted) for the forward to not change. If fact, in a vol increase scenario, the straddle spread price would need to narrow for the forward to be unchanged.
Observing GLD vol data for the past year we can see the many-to-one relationship between:
a) vol ratio and forward vol
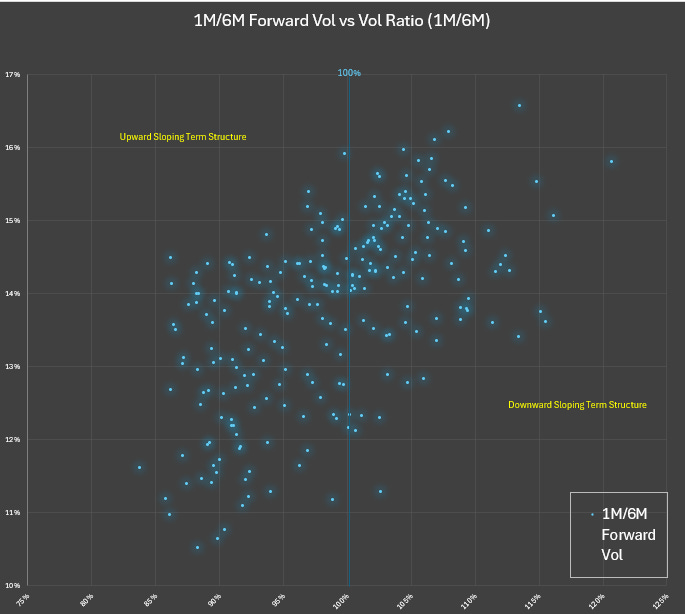
For any given vol ratio there are many forward vols. It’s not a function.
b) vol pairs and forward vol
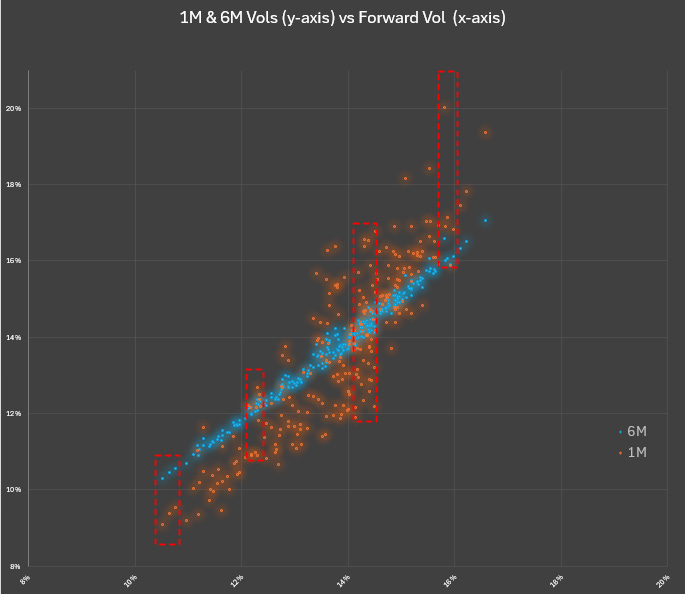
For any given forward vol, the 6M vol can be a fairly tight range while the 1M vol could be far above or below the 6M vol!
You can see how the forward vol and the 6M vol are positively correlated. This makes sense — the forward vol is driven by 5 out of the 6 months in the tenor.
You can also see that at low (high) 6M vols the 1M vol tends to be even lower (higher).
Linking the scaling relationship to vol of vol
Remember that weighting our vega by month is analogous to beta weighting a stock portfolio. Beta weighting summarizes a portfolios market exposure with respect to SPX or some other benchmark. Looking at raw unweighted vega is like ignoring the relative volatilities between stocks in a traditional portfolio. $1mm of risk in SPY is not the same as $1mm of NVDA.
√t weighting is therefore suggesting a vol of vol with respect to the fulcrum month (in our examples M1). If the back month vol is more volatile than √t suggests than our long straddle spread is long raw click vega AND weighted vega. If M1 vol increases by 1 point and M6 increases by .75 points, than the straddle spread and forward are expanding quickly. The beta of the back month vol to the front is high.
We can regress GLD 6M vol vs 1M vol to see the sensitivity. Remember a sensitivity of .41 would be √t or constant straddle spread scaling.
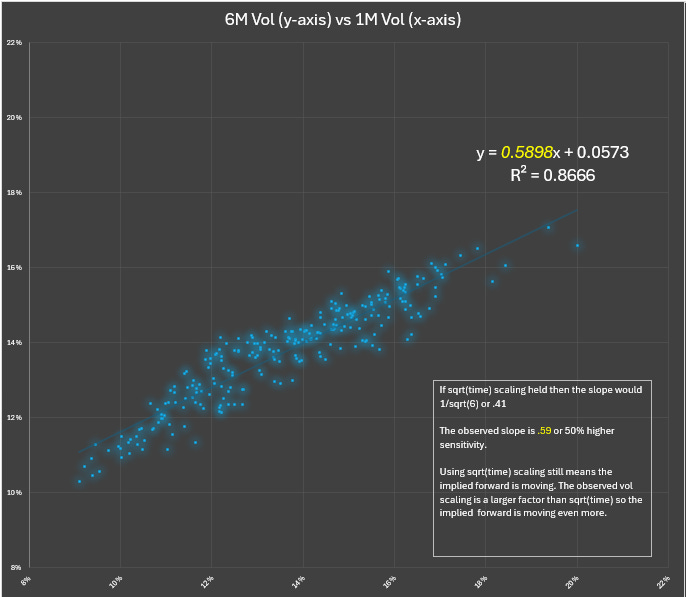
√t scaling seems to underestimate the beta of 6M vol to 1M vol. A long straddle spread would be long weighted vega not just raw vega.
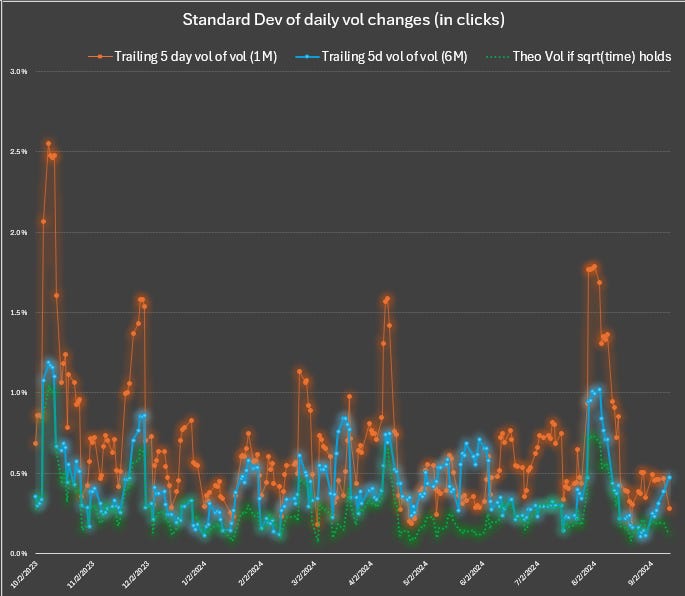
We can also compute the standard deviation of vol changes to see the vol of vol. You can see that the empirical 6m vol of vol is less than 1M vol of vol (totally expected) but it’s higher than what √t predicts.
If you truly wanted to be flat weighted vega you’d need to ratio the spread to have less units of the deferred straddle.
Takeaways and Discussion
Vol ratios are common ways to represent the steepness of a term structure.
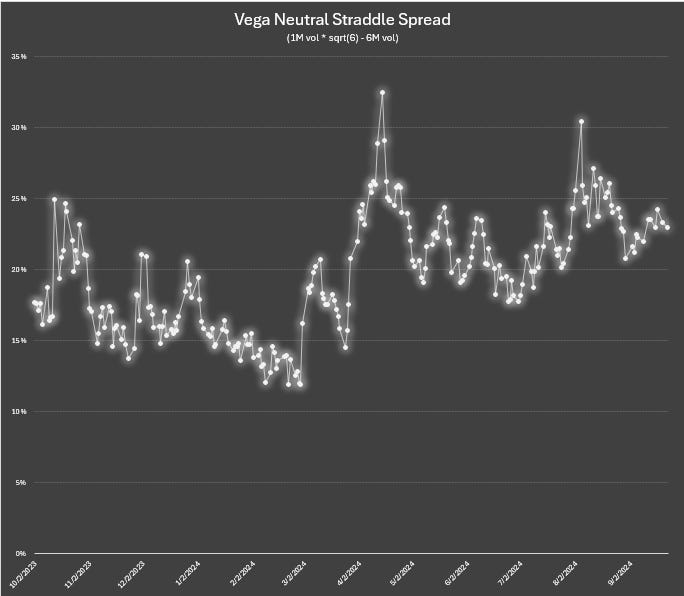
A tradeable expression of a vol ratio is the price of a vega-neutral straddle spread (using our example from today, if you buy 1 6M straddle and sell 2.45 1M straddles). Its performance mimics the vol ratio chart at the beginning of the post!
Ratios just like beta-weighting sterilizes a position from the price level to isolate the slope.
You can even track or trade straddle butterflies to bet on the curvature of the term structure.
These are popular ideas from the futures and yield curve worlds:

From that picture you can see how you might not have a strong opinion on A vs C (a slope bet that would be expressed in a ratio trade) but on the curvature between A and C (which would be expressed via butterfly or a “spread of spreads”).
The forward vol is an orthogonal measure
Implied forward vol changes even if the straddle spread doesn’t. We saw the many-to-one relationship between forward vol and the pairs they come from as well as the vol ratio.
💡Aside on Pairs trading💡
We’ve been talking about vol ratios along the term structure but we can combine our use of forward implied vols to inter-asset or pair trades.
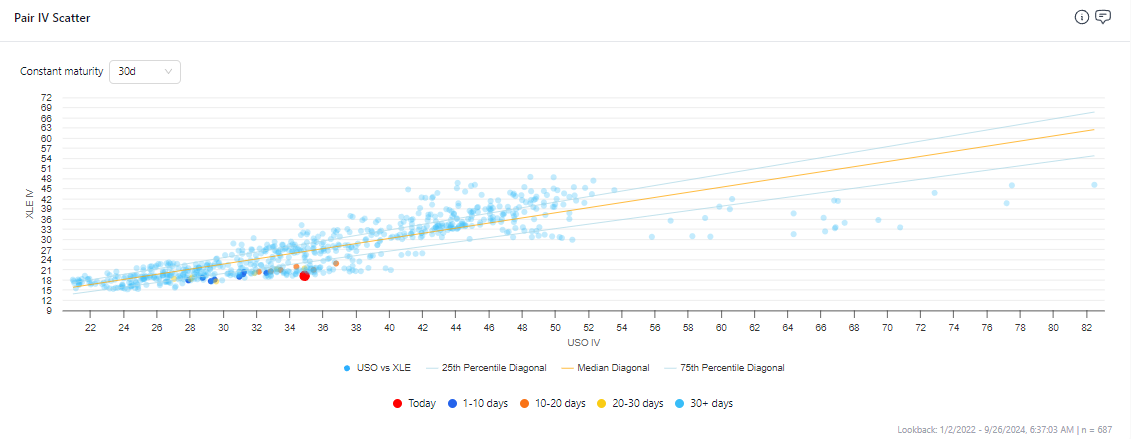
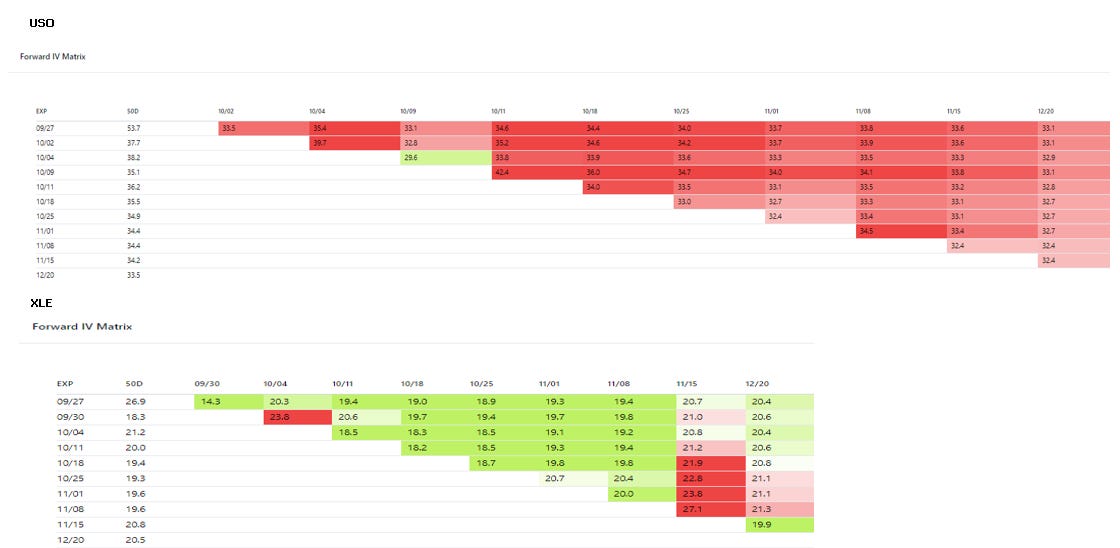
In moontower.ai we have this vol ratio tool. Here USO vol looks rich compared to XLE
But you could also compare forward vol to forward vol difference in a matrix view.
These are cobbled together from 2 screenshots but you can imagine a UI which shows a matrix of all the individual forwards. Those implied forward ratios could then be compared to a vol cone of realized vol ratios between XLE and USO.
The orthogonal nature of implied forwards gives you another set of data to run through all your conventional views to see if something stands out.
I’ve mentioned many times in my writing how I hate vol trades that start with “skew is cheap or expensive”. My experience is that the “skew knows”. It’s highly self-fulfilling. Plus implied skew doesn’t vary as widely as realized skew, so you’re forcing convergence trades on a compressed implied range that doesn’t compensate for how sloppy vol can get on destabilizing moves.
Term structure trades on the other hand. This is the place to look.
Risk limits
Deferred vols are less volatile than near dated vols. It’s important to re-scale the vega per month. √t is as sensible choice as any but your survival shouldn’t depend on any particular choice mattering that much since it will be wrong.
Just as you would never trust all of your delta risk management to the concept of beta, vol scaling weights should be taken with a grain of salt both in terms of modeling changes in term structure and in determining risk limits.
As a risk manager, if you constrain net vega without also constraining gross vega (ie the absolute value of vega within each expiry) you are inviting a situation where a book looks flat based on some weights but masks giant time spreads underneath the surface.
Examining vol of vol directly as well as placing term structures into context with vol cones can offer an ensemble view to understanding how extreme time spreads can get.
💡A word on measuring vol of vol💡
In this post, I computed the standard deviation of vol changes. Any experienced trader knows that this is incomplete. Because of spot-vol correlation and skew, vol changes are not pure. They are a mixture of moving along the curve vs the curve shifting.
Always ask yourself — “what measure correlates to how my p/l performs?”. That’s what you care about.
In this case, you want to measure the vol of strike vol not some nebulous concept of floating ATM vol.
Extending the analysis
Gold doesn’t typically see much event vol priced into it. Some macro reports like unemployment or key Fed meetings will get their bump in the term structure but it’s not the same degree as say earnings for a single stock or the annual USDA Prospective Planting report in ags like corn and soybeans. These sort of events can can 1 or 2 weeks of vol priced into a single day.
Event variance propagates through the term structure in inverse proportion to the DTE. To say it in friendlier terms…they don’t impact the deferred months much relative to the fronts.
I will re-run all these charts for another name (thinking NVDA) for the past year and see what I come up with. I expect a lower vol beta than we saw in GLD but mostly as an artifact of the near-dated vols having a much wider range because of earnings.