
Vol drag is misunderstood...until now
Vol drag does NOT change the mean or expected return. It affects the return you are most likely to experience.
Yesterday, we (yet again) discussed the topic of how vol drag affects the skewness of a return distribution. In particular it shifts the median return lower.
The thread I wrote bounced all around the internet but like a nerdy game of telephone the message is suffering from major info loss as it gets passed on.
Vol drag does NOT change the mean or expected return. It affects the return you are most likely to experience.
Imagine 2 lotto tickets — let’s call them WGMI and NGMI.
WGMI has a 50% chance of paying off $20k
NGMI has a 1% chance of paying off $1mm.
They have the same expectancy. But NGMI is far more volatile — your most likely result is a zero.
Those meme stock put spreads look expensive because they are bets on distribution not expectancy! Spreads are bets on pure probability NOT the magnitude where as outright options are about probability x distance just like expected value is about probability x outcome.
If I have an asset with an expected return of 10% the 2x version of it (without fees) has an expected return of 20%. Full stop.
However, the 2x version is more volatile, therefore its median expected return is less than 2x the median expected return of the asset itself. That’s vol drag. It impacts the median. The skewness. The distribution. NOT THE EXPECTANCY.
If that clarification was a lightbulb moment, feel free to stop right there. It’s already a good day. But if you want euphoria bursting from your skin, know that it gets better.
The following discussion includes:
- “vol bonus” the alter-ego of the drag
- the worst return I ever had in options
- a simulator you can use right now to see vol drag and vol bonus
This work will become pat of a lineage including:
- The Gamma of Levered ETFs
- The difficulty with shorting and inverse positions
- Path: How Compounding Alters Return Distributions
Let’s continue.
Vol drag predicts a median return over a set of branching paths. To understand that first think of a binomial tree where some paths recombine — for example “stock goes up $1 then down $1 is unchanged”.
Vol drag represents the median return being pulled down when we follow such a path in return space. So up 1% then down 1% doesn’t recombine back to $100 but $99.99. The more we raise the vol, the lower the median return gets pulled down. But again the expectancy isn’t changing. What’s happening is the drag of the recombining steps, the cases where a stock is “chopping” drive the median lower.
To imagine the ratio of chopping paths to straight trending consider flipping a coin twice. There’s 1 way to get 2 heads [h,h] and 1 way to get zero heads [t,t,] but 2 ways to get to exactly 1 head [(h,t), (t,h)] —the expected outcome of flipping a coin twice. The mean outcome is comprised of chop! An extreme outcome, one which is unlikely, is characterized by trend.
When we swap out coin flips and use returns we see expect something similar. The expected (ie mean) return is comprised of more toggling between up and down causing vol drag and pulling median return down. But for the expected return to not itself be lower it must be counterbalanced somewhere, right?
It is.
In the extremes, where the outcomes are part of the distribution but unlikely. The ones where you trend relentlessly up or down. It doesn’t happen often, but this is where you see a vol bonus in return space!
If a stock goes up 1% per day for 251 trading days it will be up 12x
Its double-levered version will be up ~144x not just 24x
1.01²⁵¹ vs 1.02²⁵¹
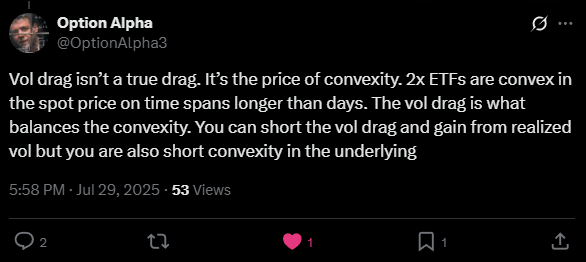
I’m the only person who “liked” this tweet. A damn shame (but that’s another topic altogether.)
I have covered this before in Path: How Compounding Alters Return Distributions in my own Pascal’s Triangle kinda-way. Part of being undereducated in ze maths means I like to look at pictures so for better or worse depending on your leaning there’s no formal notation in that post. Arithmetic and crayons.
But I want to hone in a bit more on this vol bonus thing. I’m acutely aware of it because I was on the wrong end of it — the worst loss I ever experienced on a return basis was being short options on an inverse 2x ETF — SCO. (7 figures on a few hundred contracts 🤮)
For the uninitiated, SCO is the inverse, levered ETF on oil. I was short calls on SCO when oil went straight down on a rope in 2014 as OPEC lifted drilling quotas to squeeze the US shale complex.
[You can’t just use 2x the IV of oil to price options on the 2x levered ETF…but I’ll give you a hint: if an ETF and its 2x levered are both $100, how do you find which strike on 2x levered corresponds to the 110 strike on the reference ETF?]
If the path is a trend, the return of the double-levered ETF is going to be more than 2x the return of the reference asset. The owner of the calls I was short enjoyed a “vol bonus” that, from the macro perspective, came right out of my year-end bonus.
Vol drag vs Vol bonus…ready, fight?!
Let’s walk through another example.
Scenario: 5 Days Up, 1 Day Down
Imagine a stock that gains 2% daily for 5 days, then drops 10% on day 6.
- Days 1-5: (1.02)⁵ = 1.1041 → +10.41%
- Day 6: 1.1041 × 0.90 = 0.9937 → Final: -0.63%
2x Leveraged ETF Performance:
- Days 1-5: Each day gains 4% (double the 2%)
- (1.04)⁵= 1.2167 → +21.67% (more than 2x the 10.41%!)
- Day 6: Loses 20% (double the 10%)
- 1.2167 × 0.80 = 0.9733 → Final: -2.67%
Notice what happened: bonus turned to drag
- After 5 days, the 2x ETF had a bonus (+21.67% vs expected +20.82%)
- After the volatile day 6, it shows drag (-2.67% vs expected -1.26%)
- The final return is -2.67%, which is worse than 2x the stock's -0.63%
Bonus is rare and fragile. Today, all levered ETF prospectuses (it should be prospecti out of respect for 🐙but whatever) disclose the risk of vol drag and they should. It describes the disappointment you are most likely to experience if you hang on to these things, but for those of you who care about not being faulty amplifiers in the telephone game of high-finance literacy just realize that their actual mean expectancy isn’t lower. But like a royal flush in video poker, you are unlikely to get the hand that contributes to that mean expectancy.
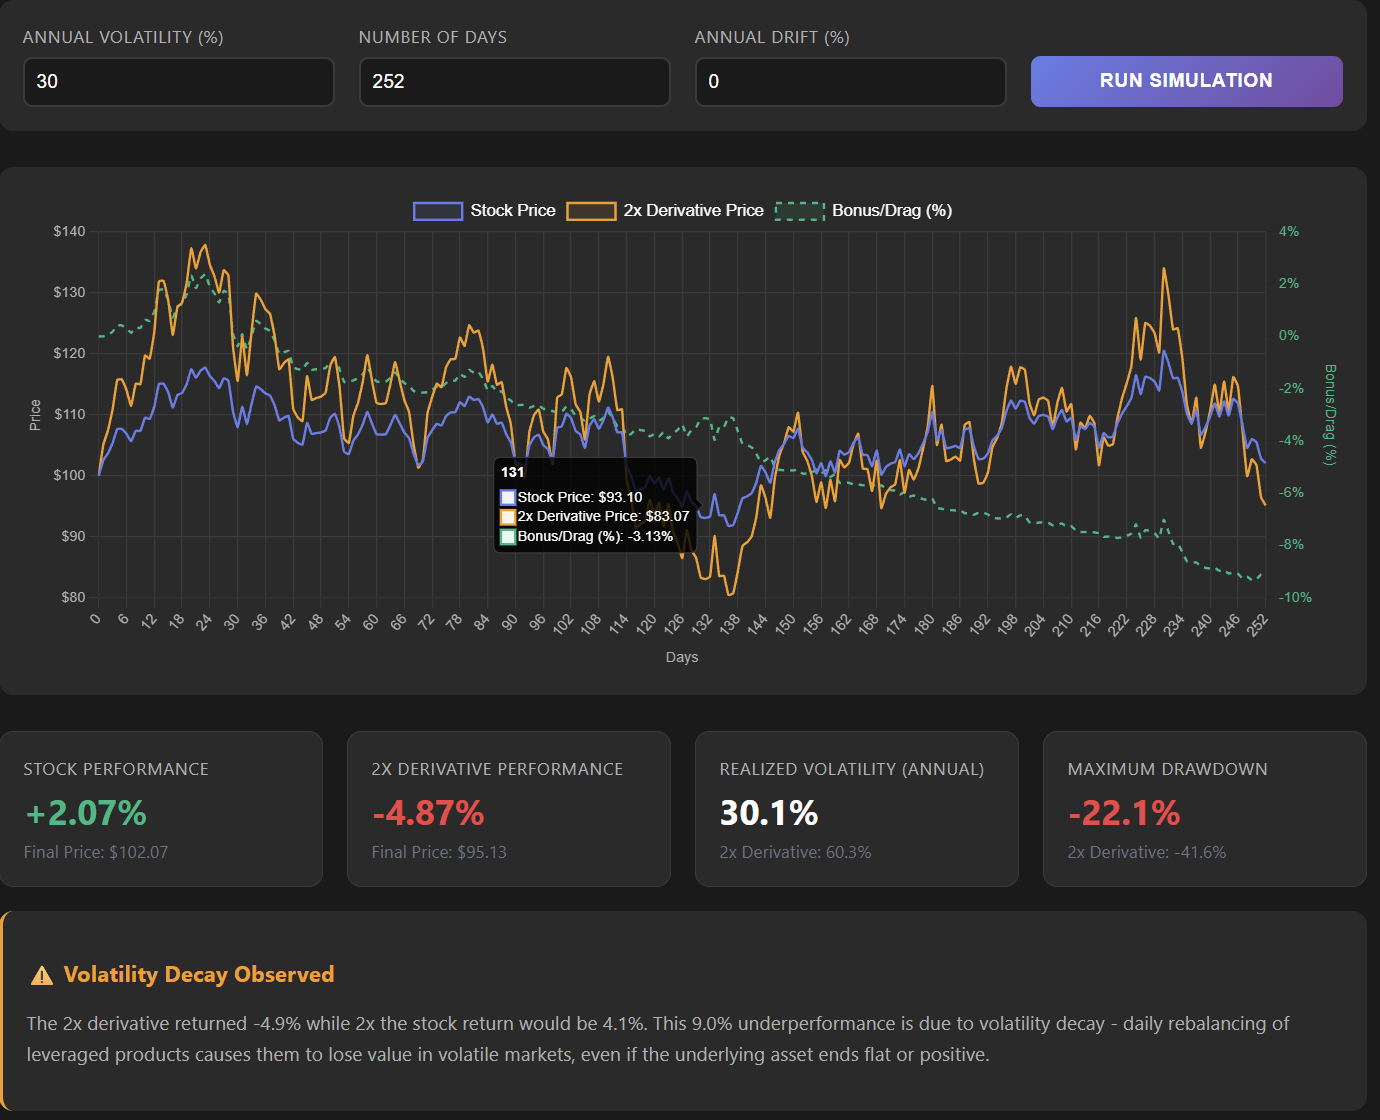
Interactive Simulator
Want to see this effect in action?
I vibe-coded an interactive 2x leveraged ETF simulator that demonstrates how different volatility levels and market paths create bonus or drag. You should really take note of how destructive vol is to your actual investing experience.
Vol bonus/drag = Cumulative levered return - cumulative return*2
(if positive it’s a bonus, negative a drag)
Final words
Vol drag does NOT change the mean or expected return. It affects the return you are most likely to experience.
Levered ETFs are more volatile, therefore their median expected return is less than 2x the median expected return of the asset itself. That’s vol drag. It impacts the median. The skewness. The distribution. NOT THE EXPECTANCY.
In the real world, levered products have direct fees as well as slippage fees because the exposure needs to be rebalanced daily. If the product has garnered lots of AUM it’s like a polar bear in the savannah — an easy mark for trading firms anticipating flow.