
vega's finishing move
how vega kills
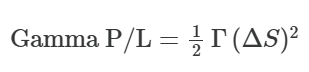
“Vega wounds, gamma kills” is an esoteric expression that’s still common enough that you can google it and return a bunch of hits. It’s a reasonable acknowledgement of realized vol p/l being quadratic with respect to how large a stock move is.
I’ve recently been cross-posting my writing on how this works on X since they’ve been pushing their Articles functionality.*
* A lot of people (and bots) are boosting these. I am treating these releases as a spaced repetition exercise for long-time readers. Analytics show very high engagement so X must be signal-boosting them. This is a 1-year chart. The recent spike is Articles: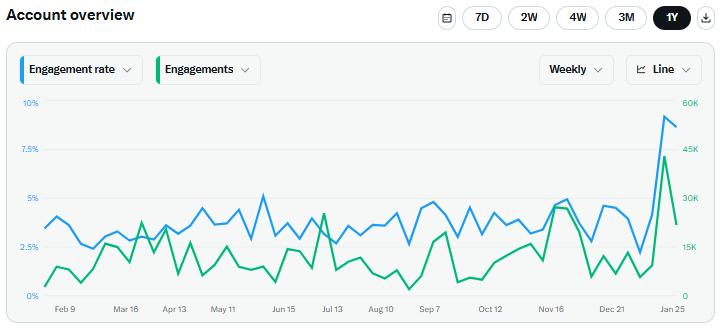
A lot of people cry about the growth of Articles longform on X but twitter is a long way from the community it used to be anyway, so don’t really care as much if I’m burning the house for warmth in the eyes of diehards. Although I don’t think I am since the reason I came to twitter in the first place was to find stuff to read and learn not hot takes. It's different things to different people and when they suppressed Substack it shifted the appeal for me. This is some re-alignment, albeit on their terms. Fine. It's a reasonable negotiation. The Articles I’ve posted on the theme of non-linearity in options
This last one is about the “gamma” of vega. For OTM options, the vega of the option, its sensitivity to changes in IV, itself changes. We call that second-order sensitivity volga. Volga is to vega as gamma is to delta.
I don’t have a dedicated post on vanna I’ll cover it briefly right now.
Vanna
The definition of vanna you are most familiar with is change in delta due to change vol. You have heard of this because of dealer flow discourse. For example, if dealers are long calls and hedged with short shares, as vol declines on a rally, their long option deltas shrink. If this happens faster than their long gamma increases their net delta, then they will have stock to buy to rebalance to neutral.
But vanna has an alternate definition. One that dominates our understanding of trading skew:
the change in vega for a change in underlying
If you are short puts on a risk reversal as the stock falls, you get shorter vol and vice versa. Your vega changes as the spot moves.
I suspect the “gamma kills” idea is popular because it’s a common experience. Option volume is dominated by near-dated expiries where gamma and theta dominate the p/l. Most people will simply never feel what it’s like to be wrecked or celebrated by volga or by a delta-hedged skew position. They might know what it’s like to get crushed to vega directly, but even that will be less familiar than realized vol-driven performance, given typical trade duration.
But I can tell you that my most memorable p/ls have all had vanna and volga at the scene. 2020 was especially dramatic in this regard as an explosion in vols led to position sizes exploding and finding myself sitting on a growing pile of vega that varied from “increasing in demand” to “panic bid”.
Qualitatively, the repricing of vega is significant because vega is illiquid. You can delta-hedge your way to a replication of a relatively short-dated option. In a sense, the volume in the underlying itself is a form of liquidity for options even if the options themselves are illiquid. But this idea extending to a long-dated option is only theoretical. In practice, if you are short a long-dated straddle that doubles in value, the mark and its accompanying hit to your capital may leave you in a forced position. You don’t have the luxury of manufacturing that vol via delta-hedges for a year.
This will be exacerbated if you were short, say 100k 1-year vega, but because of vol exploding you find that you are now short 200k vega. Maybe you can stomach the p/l hit due to vega, but you might not be able to hold the new position size. If Street Fighter’s Vega had Mortal Kombat finishing moves, they would be called vanna and volga.
The recent silver move has been so crazy that vega p/l has dominated realized p/l (realized p/l is the tug of war between gamma p/l from the equation at the opening of the post and theta). It’s an outstanding case study in how higher-order effects are fundamental to understanding options.
We’ll begin with a classic “trap” trade.
Imagine back on Dec 31st, with SLV at $64.44, you bought put and sold call on the 60/100 risk reversal delta neutral with the plan to hedge the delta at the close each day.
This position starts:
- Long vega
- Long gamma
- Paying theta (you laid out extrinsic option premium)
- The 60 put you buy is 59.6% IV, the 100 call you sell is 78.7% IV
The risk reversal would have cost you $2.89 of option premium since the put is much closer to at-the-money.
💡I used the Moontower Attribution Visualizer to compile data for this article
What happens between when you opened the trade and the snapshot I took this past Tuesday, 1/27/26, when the stock has risen to $97.09 and the options still have over 3 weeks to expiry?
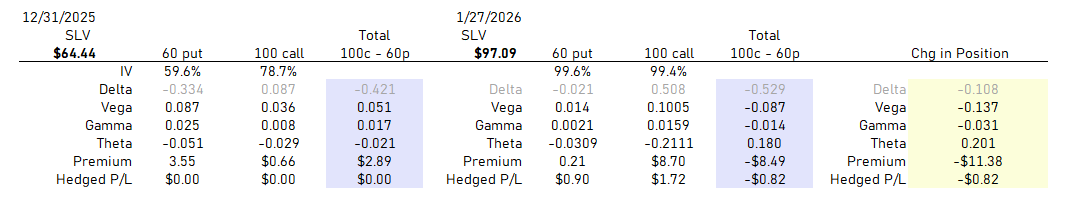
This daily hedged risk reversal has lost $.82 net.
You are short gamma albeit less gamma than you were long when you initiated the trade because the ATM vol is so much higher!
More things to note:
The IV on your long strike: 59.6% → 99.6% or 40 vol points!
The IV on your short strike: 78.7% → 99.4% or 25 vol points.
You won on the vega spread between the options.
So why did you lose money? Was it the realized vol? That seems suspect, after all, you were long gamma at the start of a big move. You’re short gamma now, yes, but it’s not even that much.
The clue is right there in the table:
You went from long 5 cents of vega to short almost 14 cents of vega as your short strike is now at-the-money.
Yes, the vol on your short strike went up much less than the IV of your short strike, BUT it went up when the vega of that strike was much larger than the vega of the strike you were long.
In short, you were getting shorter vol as vol was ripping higher. The vega p/l totally swamps the realized p/l:
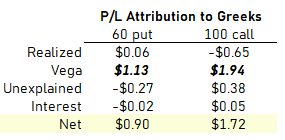
Here’s a snapshot from the interim on 1/13/2026, when the stock had rallied almost to the midpoint of the 60 and 100 strikes.
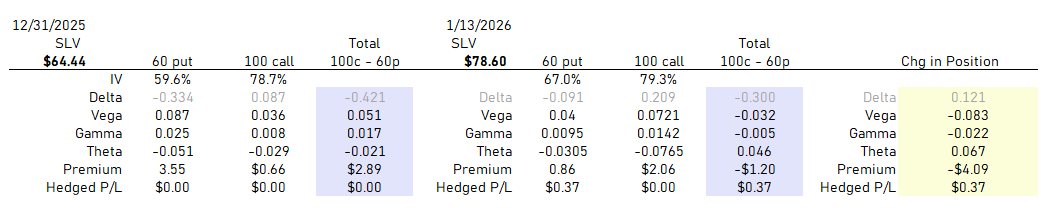
The 60 put you own has gone up over 7 points, and the 100 strike you are short barely budged from the elevated vol from the original skew. You are up $.37 on the hedged position…but your risk is changing quickly. You are now short vega, flat gamma, and collecting theta.
Wait, you are collecting theta without being short gamma.
Technically your gamma is very slightly short, but the point stands — in fact, if the 60 put IV was a bit lower you could even be long gamma and collecting theta. New option traders will brag about such a favorable greek profile. An experienced trader knows that the ratio is an indication that you are simply short a premium IV and premium IVs happen near the prices where hell breaks loose. As I’ve said many times…the skew just tells you where the bodies are:
In sum,
Despite these options not being “long-dated” their performance has been dominated by IV. In this case, mostly through vanna which is best seen at the interim.
- Despite the 60 put vol increasing 7 points, the vega of the option halved as it was now much further from ATM (it went from being a -33 delta put to -9 delta by 1/13/26)
- Meanwhile, the 100 call’s vega doubled due to it becoming closer to ATM (it went from a 9 delta call to 21 delta).
- Note that volga is not playing much of a role in 100 call vega doubling. The change in option vega can’t be due to IV increasing. Why? Because IV didn’t change on the 100 strike during the rally from $64.44 to $78.60!
From the vol convexity article, we know ATM options have no volga. In fact, ATM vega is insensitive to vol level and holding DTE constant, it only depends on the spot price!
But OTM options have a lot of vega to gain if IV increases since IV ripping higher makes all OTM options look closer to ATM as they are “less far away”. Their delta increases (vanna) and their vega increases (volga). In the above example, the 100 call IV did not rip higher by 1/13/26, so we couldn’t see volga in action. The vol only roofed on the strike once the option was close to ATM.
To give volga its due, we should zoom in on Monday when Feb SLV vol ripped higher on silver popping 10% (before giving back nearly half its gain).
We’ll look at a call nearly 14% OTM with less than a month til expiry.
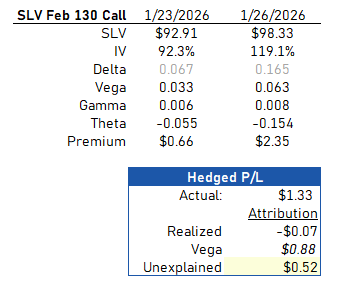
The $1.33 of hedged option p/l for that call is only partially explained by the initial vega of .033 and a vol change of 26 points. The difference could be explained by the fact that the average vega of the call as vol (and stock) increased was probably closer to .05.
26 vol points x .05 vega = $1.30
Since the stock only rose by 6%, we can safely guess that the 50% increase in the vega of the option is mostly driven by volga.
Gamma is not the only killer. Any position that grows faster than the underlying changes contains risk that is not seen in a snapshot. That delta hedged vertical spread or risk reversal might look gamma, theta, and vega neutral today but that profile gets battered as soon the clock ticks and the waves start coming in. The snapshot neutrality is dangerous because it can easily lull you into thinking your risk is smaller than it really is.
Ask anyone who bought an SLV and nat gas 1x2 call spread because “the skew was fat” or because they are “long gamma, collecting theta” how that’s working out?