
using elementary school geometry to explain gamma
gamma p/l is the same as distance covered via acceleration
In options land, you constantly hear the returns are “non-linear”, “convex”, or maybe even “have curvature”.
It comes from the fact that there’s a squared term in the p/l function which comes from gamma. Mechanically, it comes from the fact that your position size isn’t constant. It accelerates. If your position starts as 1,000 shares and the asset moves $2 but your position at the end of the move is say 3,000 shares, then your p/l is going to be more than $2,000. At some point you were bigger than when you started.
Your delta, also known as your sensitivity of your p/l to the stock changed.
I’ve covered convexity and gamma in depth before.
But I thought I fun way to show this would be to see how it’s exactly the same math as what you learned in middle school when you learned about speed and distance.
There are 2 graphs in particular that every kid learns that both show:
Distance = rate x time
A time-distance graph

The slope is rise/run, or in this chart, distance/time. 400 miles in 10 hours = a speed of 40 mph
I know it’s hard to remember but there’s another chart they are subjected to.
A speed-time graph

There’s no acceleration as the speed is a constant 40 mph. The area of the rectangle under the curve is base x height or 400 miles. It represents the distance. Base x height maps to time x rate.
Let’s extend this to a situation where there is acceleration. Instead of a constant 40 mph, let’s average 40 mph by starting at 30mph and ending at 50mph over the 10-hour journey.
We estimate acceleration with: (ending speed - starting speed) / time
(50-30) mph / 10 = 2 mph
Averaging 40 mph for 10 hours covers the same 400 miles of distance as traveling 40 mph at constant speed but the graphs are different.
Constant Speed vs Acceleration

What to notice:
🌙The Time-Distance chart with acceleration is “curved”
🌙The Time-Speed chart with acceleration decomposes the distance covered into a baseline of 300 miles (30mph starting speed x 10 hours) plus the additional 100 miles due to the 2 mph increase in pace every hour. The area of a triangle is just 1/2 the area of a rectangle.
Another way to think of that “triangle” is to just reason out the gain in distance.
With 2 mph acceleration for 10 hours your total acceleration is 20 mph. The average acceleration boost is just half that or 10 mph.
avg boost x hours
where:
avg boost = 2mph * 10 hours/2 = 10 mph
10 mph x 10 hours = 100 miles of distance covered due to acceleration
Or generally:
(acceleration per hour) * change in time/2 * change in time
distance due to acceleration = 1/2 * acceleration per hour * (change in time)²
[You may remember the function from back in the day:
d(t) = 1/2 at²

Again that’s the triangle area of the Time-Speed Chart ]
From acceleration to gamma
Here’s a straight substitution:
speed ➡️ delta def: share equivalent position
acceleration ➡️ gamma def: how many deltas you gain per $1 change in the stock
distance ➡️ P/L def: profit or loss
change in time ➡️ change in stock price
Assume:
- you have shares of a stock that starts at 0 (or any starting price)
- your option position gives you a constant gamma of 200 shares therefore every $1 the stock goes up you get longer 200 shares
The graphs are exactly the same we just changed the words.
Time-Distance chart ➡️Stock vs Profit chart
Time-Speed chart ➡️ Stock vs Delta Position
In the zero gamma scenario, you start with 4,000 shares and the stock goes up $10.
In the 200 gamma scenario, you start with 3,000 shares and the stock goes up $10. That means your starting shares are 3,000 but ending shares is 5,000.

In the speed example:
distance due to acceleration = 1/2 * acceleration per hour * (change in time)²
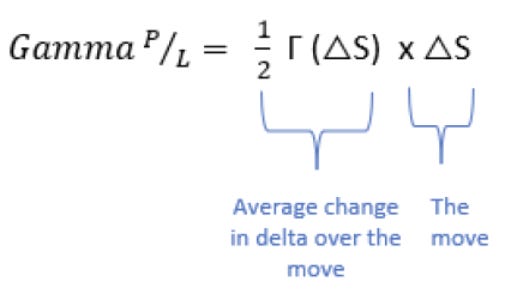
The analog for options:
p/l due to gamma = 1/2 * gamma per $1 * (change in stock)²
This is exactly what we showed in moontower on gamma:
Which explains why option p/l is a squared function of the stock price change. Hence the non-linear or “curved”p/l.
Practice
If you own an ATM straddle on a stock that has zero delta and your brokerage model says your gamma is .20 per straddle (so .10 for each of the call and the put) then for every $1 the stock goes up you get longer 20 deltas or “shares” (remember options have a 100 multiplier)
If the stock goes up $3, then you estimate your p/l due to gamma as:
1/2 * 20 * $3² ~ $90
If the theta or cost of the straddle is .10 or $10 with the multiplier than your net p/l due to the stock’s movement is $80.
Notes
1. Your gamma and theta are themselves not constant so this is an estimate. The remainder of your p/l will mostly be driven by the change in implied vol of the straddle times the vega
2. The general formula for delta-hedged option p/l is very accessible if you understand the above

It’s the tug-of-war between how much we moved vs what was expected. If positive, we moved more than implied and if it’s negative the move couldn’t cover the theta.
For long options, theta is a cost. Similarly, if you are short options you only get paid the “full theta” if the stock doesn’t move at all. How much you collect is reduced by how much we move, but the move function has squared exposure.
Hope that helps the theta is an edge crowd who says you sell options because they decay. Well, yes there’s always a theta but it’s only half the ledger.