the option market's point spread
Part I of a discussion of VRP
Part I of a discussion of VRP
The volatility risk premium (VRP) is the notion that options are generally overpriced. Not all the time, not in every name, not across the entire surface. Just in general.
What to do with this information is another matter.
If their premiums are higher than their cost to replicate you can sell them, hedge, and earn a profit. If the expected value of owning an option is negative you can still buy them to make an existing portfolio safer. The combination can be a better proposition than looking at any of the line items in isolation.
Either way, we want to separate price from value.
In Primer #8: Top of the Funnel: Cross-Sectional Fair Value, I define how moontower.ai computes VRP but we’ll use a slightly simpler computation for this post:
VRP = 1-month implied vol (IV) / 1-month realized volatility
- The implied volatility is “constant maturity”. This means we interpolate between the 2 closest expiries which surround 30 calendar days into the future. The interpolation is linear in log(time). Or you can linearly interpolate variance (ie volatility squared) and convert back to volatility. Same thing.
- The 1-month realized vol for this post is simply the sample standard deviation of the last 20 daily logreturns annualized by √251
If implied volatility is 20% and the realized volatility is 15% then the VRP is 20% / 15% or 1.33.
In the moontower tools we’d refer to this as 33% or VRP - 1 to represent it as premium/discount.
If the implied vol was only 14% then the VRP is 14%/15% - 1 = -6.7%
Forward-looking vs backward looking
Implied volatility is set by market consensus. It’s the number that makes an option model spit out the price for calls and puts that actually trade. It’s both forward and backward looking.
It’s backward-looking because traders use history to handicap what volatility can be. SPY and TSLA behave differently. You’d love to buy TSLA options for SPY implieds and sell SPY options at TSLA implieds. In fact you’d pay for the privilege. So would everyone else. Your bid price to this is a pairwise microcosm of how the options surfaces in the world arrange themselves in a giant, relative matrix. Much of that matrix is pulling from how these assets move and co-move. That’s historical info.
Right now, is a great example of how option markets are also forward-looking. With the US elections approaching, there is an outsize chunk of 1-day variance waving to us from nearly every option term structure. This is TLT with the maturity dominated by the election highlighted:
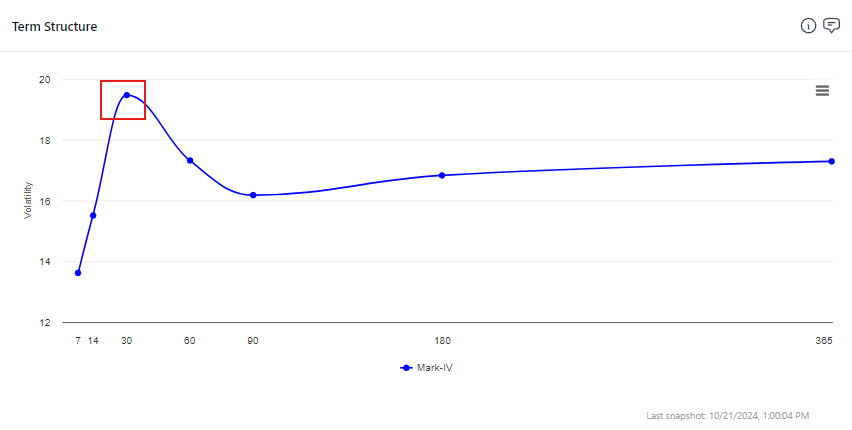
This volatility is less driven by the past moves. a projection of past moves is blended with an estimate of how much bonds might move on election day.
💡See Understanding Implied Forwards to learn more about the blending.
This highlights the tension of VRP ratios. The numerator knows things the denominator doesn’t.
From the Primer:
The VRP ratio divides IV, a forward-looking measure, by a lagging realized volatility. We understand both the embedded utility of such a measure —vol clusters, so recent volatility is correlated to the expected future volatility; and the tension that the numerator anticipates the future while the denominator reports the past. But there is a wrinkle around known events that distort our interpretation of the measure. The following examples characterize the distortion:
1) Upcoming earnings or FOMC day
Implied volatility will anticipate the extra variance associated with the upcoming event, artificially widening the VRP. Professional option traders will use quantitative methods to extract how much extra variance the market is assigning to the event to “clean” the IV. Ideally, VRPs would be adjusted for known events. There is no single accepted technique for cleaning the IV but the quick solution is a judgment — “XYZ has an abnormally high VRP, but I just noticed it has earnings next Tuesday”. [The moontower.ai roadmap includes providing a calculator to allow a user to extract an event. In the meantime, you can use term structure tools (described later) to “see” where the market anticipates events]
2) Earnings have recently been reported
This is the opposite failure mode of the VRP measure. A stock had a large earnings move which carries significant weight in the realized volatility (the denominator of VRP) but the IV is looking forward to a period where there is no news expected since the company has already given guidance, had a conference call, and reported financials. This will artificially depress the VRP. Again, judgment is in order. It’s best to compare the IV to periods of realized vol without the earnings move.
Quants have spent many a brain cell trying to forecast volatility. For good reason. If your forecast is better than the one embedded in the implied, you could Doordash Sizzler like a boss.
In the moontower.ai tools we can see how well the implieds predict the realized vol.
This is double-paned chart is XBI 30d IV vs 30d realized vol. The top panel shows how the implied vol is usually a bit rich to the realized but not always.
In the bottom panel, we toggle “Lag IV”.
This lags the implied vol so we can see how IV tracked the ensuing realized vol. You are looking at the realized vol next to what the implied vol was a month ago (hence the “lag”).
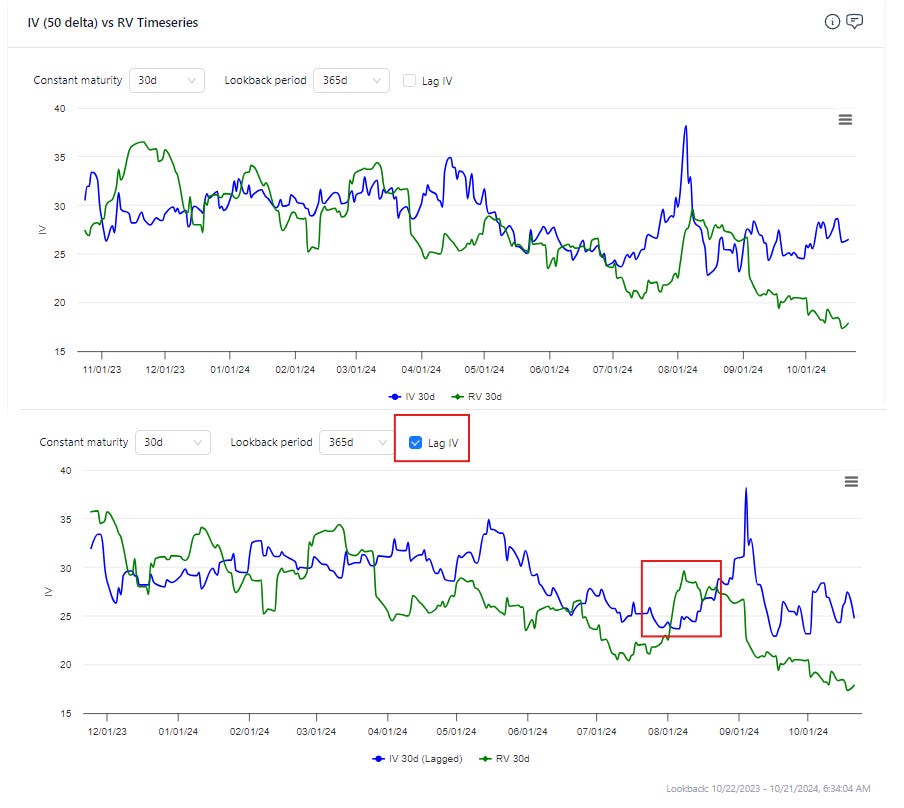
The red box on the chart is August 5th. The realized vol naturally shot well over the IV from a month earlier (in other words, if you bought XBI options in in July they were cheap compared to the movement August 5th had in store). In addition, the top panel shows how IV itself also shot up on August 5th. But as you look back at the bottom panel, you can see how that elevated vol turned out to be much higher than the realized vol that unfolded the remainder of August as the stress seemed to depart as quickly as it showed up.
For the rest of today we will examine data from the past year to get a feel for the VRP in lots of tickers. VRP is a popular topic in options, you’ll want to understand its shape.
It’s the option market’s point spread.
Setup
I looked at closing data for the past year (10/11/23 to 10/16/24) to fetch 30d IVs and 20d close-to-close realized vols for each trade date.
📅There are about 21 trading days in a 30d calendar month so the time windows are lined up well enough.
Table

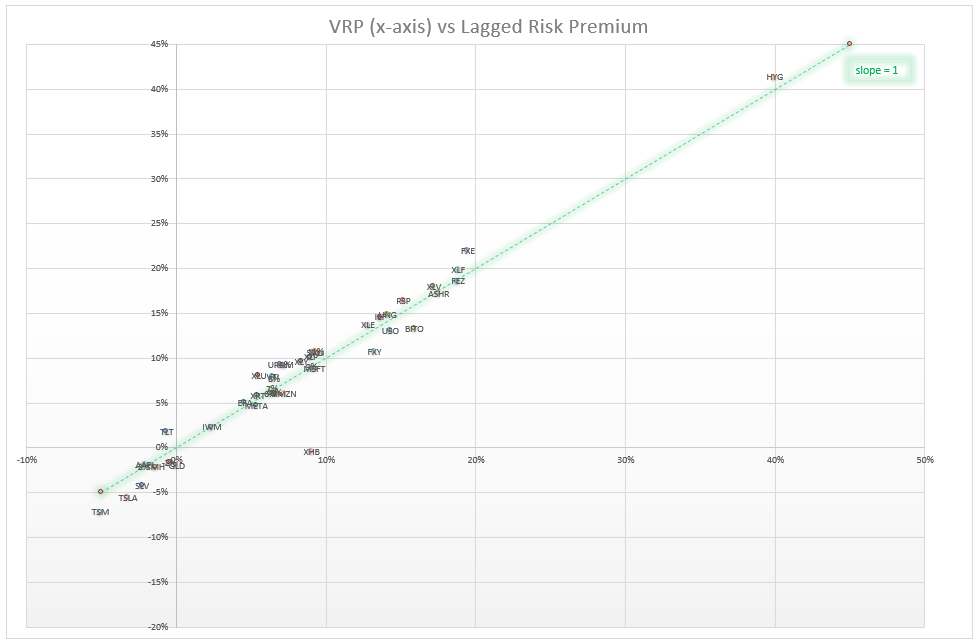
The table shows the average VRP (as well as the standard deviation of the VRP) and the average lagged VRP which tells us the average premium/discount the implied vol had to the ensuing realized vol. To a sports bettor, this is like asking “how did the realized vol do against the spread?”
Observations:
- SPY, on average had implied vols 9% premium to 1-month realized (ie if 1-month realized was 10% the implied was 10.9%)
- There is a positive VRP in most names.
- The single stock names at the bottom of the table were underpriced volatility on average. A glancing thought — vol traders have noted (lamented?) extremely low levels of implied and realized index correlations for the past couple years with index volatility trading historically low compared to single stocks. This high-level snapshot shows the single-stock vols are not even absolutely expensive.
- Many of the foreign vols were much higher than the realized. HYG is always expensive but trades at an absolute low level of volatility. One thing to appreciate about volatility is that standard deviation is only one varietal of risk. In the presence of skew, focusing on standard deviation is misleading. The standard deviation of a balanced coin flip is 66% higher than a biased 90/10 coin flip. But would you conclude the balanced coin is riskier? See 🤡Skew Is A Hall of Mirrors
- Finally, note how well the average lagged VRP affirms the average VRP. If you average across all these names for the past year both the VRP and the lagged VRP (ie how the IV did compared to the ensuing realized) stood at an 8% premium to prior and eventual realized vols! The names below the slope =1 line have on average outrealized their implied vol.
Crossing a 4-ft deep river
You know how this story goes. If you want to cross a river, it’s not enough to know how deep it is on average.
So far all we’ve done is look at averages.
Looking at all the tickers zoomed out, the average VRP by name reflects how expensive the options are compared to the realized even on a going-forward basis. It’s a buzzkill.
Until we look under the hood.
Let’s open up SPY.
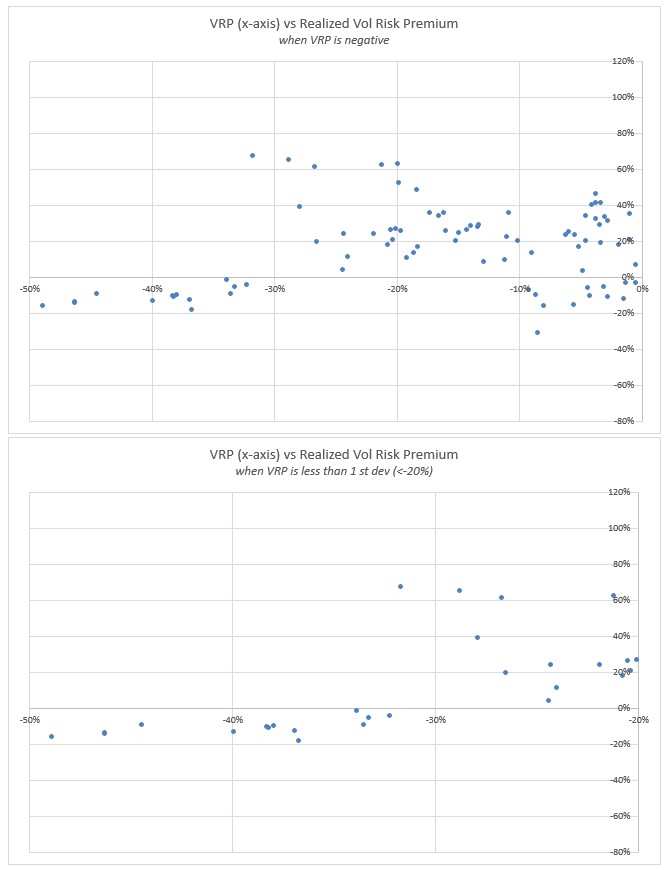
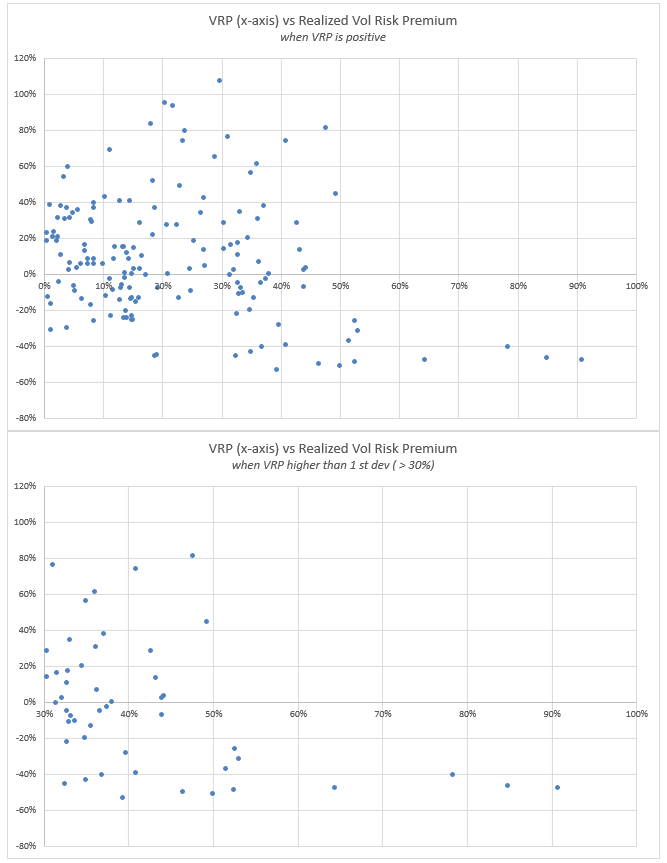
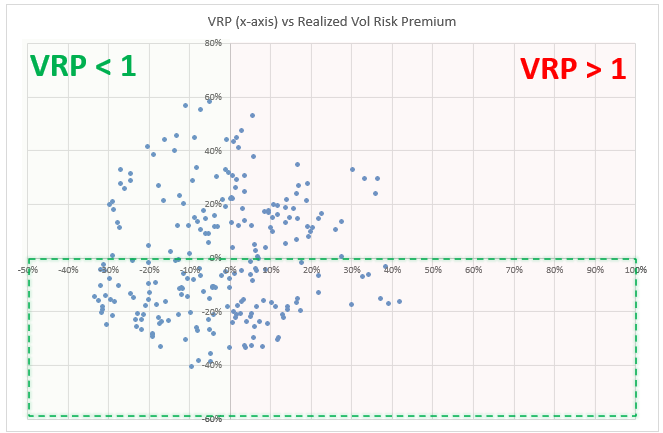
The x-axis is the VRP while the y-axis is the VRP that end up being realized over the next month. This is not well-behaved. There are times when the VRP is
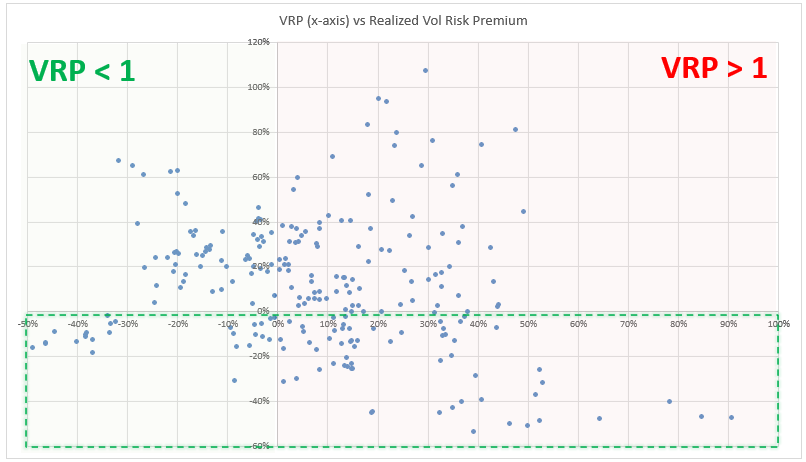
- The upper left quadrant = “low VRP but realized ended up underperforming”
- The lower left quadrant = “low VRP and realized outperformed the low already discounted IV”
- The upper right = “these were good sales — vol that screened high and realized couldn’t catch up”
- Lower right = “vol was high and turned out not to be high enough”
We can zoom a bit further by halves.
When VRP is negative…and VERY negative:
When VRP is positive…and VERY positive:
And finally, the time series which shows how the serene surface behavior of averages is really a river of many depths:
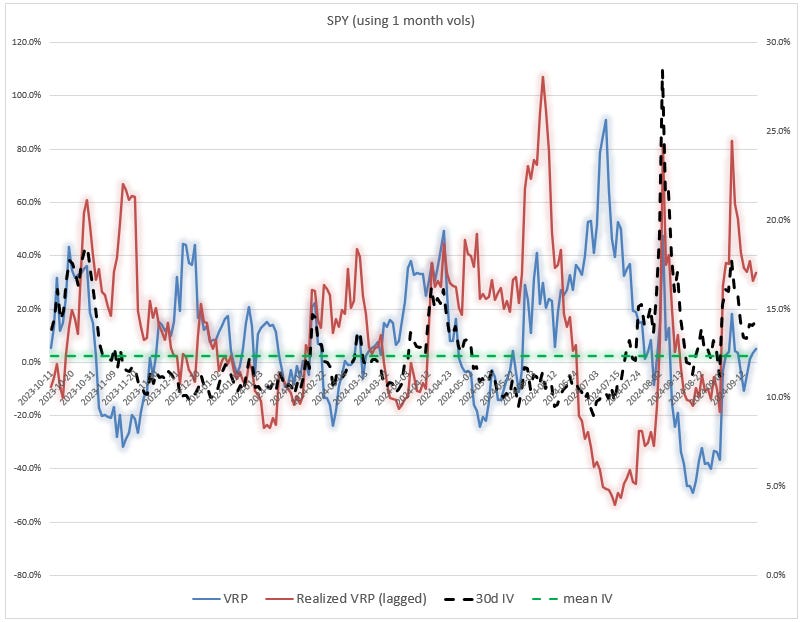
- We see that when the VRP dips, it’s often the case that the realized VRP (red line) spikes meaning that the low VRP wasn’t low enough! Selling low VRP can absolutely payoff. The reason I added the IV line in there is because, low VRPs are often coincident with high volatility. Why? Because the market expects mean reversion back to more normal levels of volatility. What surprised me about this chart is how low VRPs even at low IVs failed to reward the option longs.
- You can again see Aug 5th — when the red line or realized VRP goes sharply negative it shows how the realized vol was much higher than anything July anticipated. You can also see the VRP (blue line) collapse shortly after the stress as the options market discounted the previous elevated RV and looked ahead to more normal times.
- A general caution — you cannot tell from this char whether the high or low VRPs are being driven by the numerator or denominator. (This is why the first 2 filters in the moontower.ai funnel are the Dashboard and Real tools explained in the Primer — a glance at both of those charts and you know what’s fueling the ratio.)
Let’s do one more. GLD.
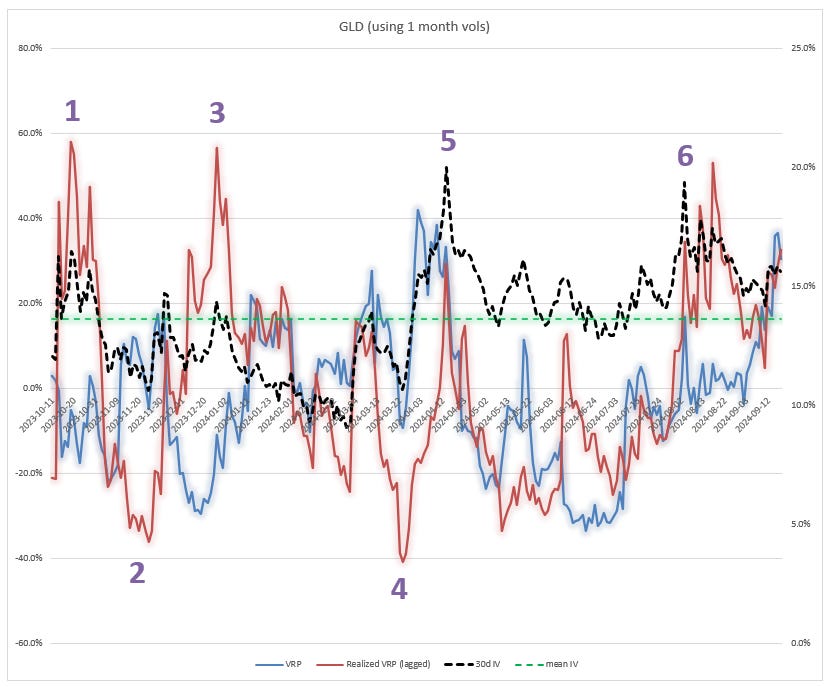
I’ll narrate the numbered sections:
- IV is elevated but realized vol must be high since the VRP stayed muted. The options ended up being highly overpriced as the spiked red line indicated the realized VRP approached 60%! We can see that the IV cratered from about 16% to 11% from Oct to Nov 2023. Considering how the VRP (blue line) rose during that period we can infer that the realized utterly collapsed.
- When the vols got under 12% they were a huge bargain. The lagged VRP showed the vols being much cheaper than the ensuing realized.
- Once again, IV popped higher, VRP didn’t follow, in fact the options were trading at a large discount to RV — and correctly so it turns out. The lagged VRP was brutal for the longs.
- The lowest lagged VRP got all year corresponded to vols and VRP getting cheap. The obvious trade paid off.
- Another relatively obvious one pays off — IV and VRP spike and sure enough those vols couldn’t support the ensuing realized.
- This was yet another obvious one that paid — the one I wrote up in Flash post on GLD vol and Options Are ALWAYS About Vol. Vol roofed, VRP popped and the ensuing realized massively underperformed.
Closing thoughts and what’s next
Option markets are games not problem sets. You don’t solve them.
There’s no single killer metric. You are constantly triangulating against everyone else whose is also triangulating. You can’t look at VRP in isolation.
- What’s driving the numerator vs denominator?
- What’s the distribution of the variable in the numerator vs the denominator?
- How do other tickers compare using the same sets of lenses?
While none of the math here is beyond 6th grade, this is a lot of mental shape rotation. It’s cognitively demanding every time you hear or read “VRP” or “lagged VRP” if you have to translate in your head “high VRP means IV is high compared to…blah blah”.
Just like learning requires looking away from the page and re-stating what you’ve studied in your own words, you need to practice. Look at option chains and vols, try to come up with trades and talk yourself out of them. What you can’t talk yourself out of becomes a candidate.
If you’re already reading this far you’re paying for the substack — sign up for moontower.ai, you get the substack for free, and you can practice every day with the tools. (I say it and I mean it — the cost of the software rounds to zero if you actually trade. The true cost is the practice of getting better.)
[Btw, if you are a professional whether a broker, trader, writer, investor this lens will tell you quite a bit about what the options market thinks about a name which is useful for taking risk or providing unique context to clients, readers or stakeholders who are trying to pull signal from noise.]
A word on data hacking
- I used overlapping data since I’m looking at rolling 20-day windows every day over the past year. This “shrinks” the sample size tremendously. It’s ok for this context since we aren’t drawing conclusions or trying to estimate frequencies. The point of this post is to give you the shape of VRPs and to inspire your own explorations by giving you some angles you may not have considered.
- In the time series chart, I’m narrating from left-to-right. But when I say the IV is high or low, presumably versus the “mean IV” green lines, I’m cheating. The mean IV is based on the 1 year history of IV that we studied but if it’s March 2024, my definition of “high” or “low” vol will depend on prior data only. The green line is “snooping” into the future if you read from left-to-right. One could correct for this by keeping track of what percentile or z-score the IV is in compared to its prior history (we use percentiles in multiple contexts in moontower.ai — they are suitable for identifying unusual values).
Next…
In next week’s follow-up we go bit deeper to appreciate how you can manipulate the inputs into VRPs to identify potential vol trades. I said VRP is the option market’s point spread.
Except for a tiny wrinkle.
There’s no single line.
