
the dirties are down the cleans are up
On June 2nd I tweeted:
June expiry in USO vol change on the 3% rally... OPEC agreed over the weekend to hike production...but you saw the Ukraine-Russia developments. Competing bullish/bearish effects Vol is lower today if you look at the June surface.

But it's probably up on the day on @moreproteinbars dashboard.
Why?
(a junior option trader interview question @bennpeifert might ask would be compute the actual vol change)
An eager beaver wanted the answer key:

I wouldn’t share Tina’s answer key even if I had it. And I don’t. But understanding how to answer my “interview” question is definitely a prerequisite to Tina’s process.
And we can discuss that because the answer is available from putting together a few key concepts that I’ve already written about in detail. The concepts are conveniently self-contained within just 2 previous articles.
To try to pack even more learning we’ll add some spice for those of you who want to grab a pen and paper to give it a go — I will pose the question with some data to you and Google’s NotebookLM to see how far you each get.
If you want to just read along through the solution without burning glucose nobody is gonna judge you.
Decomposing the vol change on Monday after the event
Let’s start with the 2 articles that hold the keys:
I passed those to NotebookLM.
Now the question as I posed it to NotebookLM:
Scenario
OPEC nations are having a meeting on the weekend of May 31–June 1.
At the close of May 30, near-dated options have an "event premium" baked into the implied vols (note: these vols are based on a standard 365-day model).
In other words, the quoted vol includes the upcoming event, as opposed to having the event premium removed. If we had the event premium removed, we’d call that the "clean" vol.
On Monday, June 2, the implied vol is actually up, and the USO (oil) ETF is up 4%.
Question:
Net of two opposing forces —
- The weekend effect and
- The fact that the event premium comes out of the surface —
is the clean vol up or down on Monday morning, and by how much?
We’re focused on the June 13th expiry.
- Vol at the close of May 30: 36.2%
- Vol on the morning of June 2: 37.3%
Action items:
- Can you conceptually set up the solution to the question?
- Can you compute the clean vol change (i.e., back out the effect of weekend decay and event premium)?
This is your time to try #1. Include the assumptions you’d need to make. (This would be a good interview question for an option trader.)
I’ll confess, there’s not enough info to solve #2. I posed it to the LLM to see what it would say (all of the LLM output will be shared below).
I’ll handle #2 in the solution but there’s enough here to at least identify the data you need.
“dirty vs clean vols”
Dirty vols are the IVs generated by an option model. Whenever you look at an IV from a vendor or broker you are looking at a dirty vol.
The most common models assume a 365-day year. They assume every day is created equal. There are also 251-day models (these subtract weekends and holidays). A 251-day model assumes time only passes on business days. Regardless of which model you use (as long as you don’t mix and match), if you are comparing vols between assets on the same calendar this assumption cancels out. Not a concern.
“Clean” vols are an attempt to smooth vol changes rather than accept artifacts from the market understanding that vol time doesn’t pass uniformly. Not every day that rolls off a calendar is 1/365th in vol time. And weekends aren’t just zero time.
Vols can be cleaned by adjusting the DTE in a standard model to the DTE in a more accurately specified calendar.
But we can clean vols for events as well.
Clean vols remove or extract events so they can be compared both along an asset’s own term structure AND across assets. If NVDA has high vol because of earnings it doesn’t mean it is expensive compared to QQQ. You want to compare event-normalized or clean vols.
cleaning the USO vol for both the OPEC meeting and the weekend
Let’s focus on what we observed from our dirty 365-day model for the June 13th expiry.
- Vol at the close of May 30: 36.2%
- Vol on the morning of June 2: 37.3%
In that model how many days to expiration (DTE) are the close of May 30th and the open of June 13th?
Close of May 30th = 14 DTE or 14/365 ~ .03836 of a year
Open on June 2nd = 12 DTE or 12/365 ~ .03288 of a year
Because of weekend theta effect, an artifact of treating weekend days the same as business days, we expect dirty vols to go up on Monday just visually if the clean vol is unchanged. To reiterate from that post, a 365-day model treats every day the same, but the market understands that “vol time passes more slowly when the market is closed” — which means in a properly specified calendar there is relatively less DTE transpiring over the weekend than what you see in a 365-day calendar. On Monday morning the 365-day model thinks there is relatively less DTE compared to a better-specified model so for a given option price the dirty vol (ie 365-day model vol) must adjust higher.
In the dirty model, .00547 of the year elapsed [ie .03836 - .03288]
We’ll use a calendar specification from that weekend theta post where we say that non-business days count as 50% of a business day for vol time purposes.
If we continue to denominate our basic unit, a full trading day, as 1.0 and weekend days or holidays as .5 we get the following tenor:
251 x 1.0 + 114 * .5 = 308 day calendar.
Using this calendar let’s see what the DTE is on the close of May 30th.
Close of May 30th = 10 regular days + 4 weekend DTE which get a weight of .5 or 12. We divide that by the 308-day ruler. 12/308 ~ .03896 of a year
Note there is more time to expiration as a percent of a year than the 365-day model which only had .03836!
To convert the dirty vol to the cleaned 308-day model vol we multiply by the root of the relative DTEs
36.2% x √(.03836/ .03896) = 35.9%
Note that we expect a lower IV in the clean model because for the same option price we had more time ‘til expiry — so the vol must be lower in the the model with more DTE. This is a good double-check on numerator/denominator confusion when converting.
Where are we?
At the close of May 30th, we observe a dirty vol of 36.2%. when we clean it with a 308-day model which assumes variance passes half as fast on the weekend we compute a clean vol of 35.9%
So for the vol to be “unchanged on the morning of June 2nd” we need to observe a dirty vol that translates to a 35.9% clean vol.
That’s a simple algebra problem using the relative DTEs on the morning of June 2.
We already calculated the dirty DTE that morning to be .03288 as a fraction of the year.
What is the clean DTE according to a 308-day model?
10 business days + 2 weekend days which get 50% weight = 11 days divided by 308-day year:
11/308 = .03571 = clean DTE as a fraction of a year
Recall:
Dirty DTE on the June 2nd open is only .03288 of a year
Note that the gap between clean DTE and dirty DTE has grown even wider which is a clue that the dirty vol the model implies must go higher for a given option price.
Here’s the algebra:
Clean IV * √(clean DTE/Dirty DTE) = Dirty IV
⚖️You may have noticed that this is just a re-arranged balancing identity where:
Clean Variance * Clean Days = Dirty Variance * Dirty Days
It might be easier to remember that and conjure the algebra as needed.
Again the question we care about is what does the dirty IV have to be such that we believe the clean vol of 35.9% is unchanged?
35.9% * √(.03571/.03288) = 37.4%
The dirty vol must go up to 37.4% for the clean vol to be unchanged!
The dirty vol went up to 37.3%…pretty close to unchanged clean vol even though any vendor tool will tell you that IV is up.
I suspect Tina’s dashboard said vol was much closer to unchanged than up over 1 click.
…except there’s this giant elephant in the room.

How much vol should come out of the surface after the meeting?
We start with asking how much vol was baked into the surface before the meeting. The technique is described in how an option trader extracts earnings from a vol term structure so I’ll just skip to output.
It looks like there was a small amount of event vol baked in. I’d estimate about a 2.50% straddle for the move which equates to a 1-day 50% annualized vol.
The picture below is the result of changing the move size until you get a relatively smooth vol term structure.
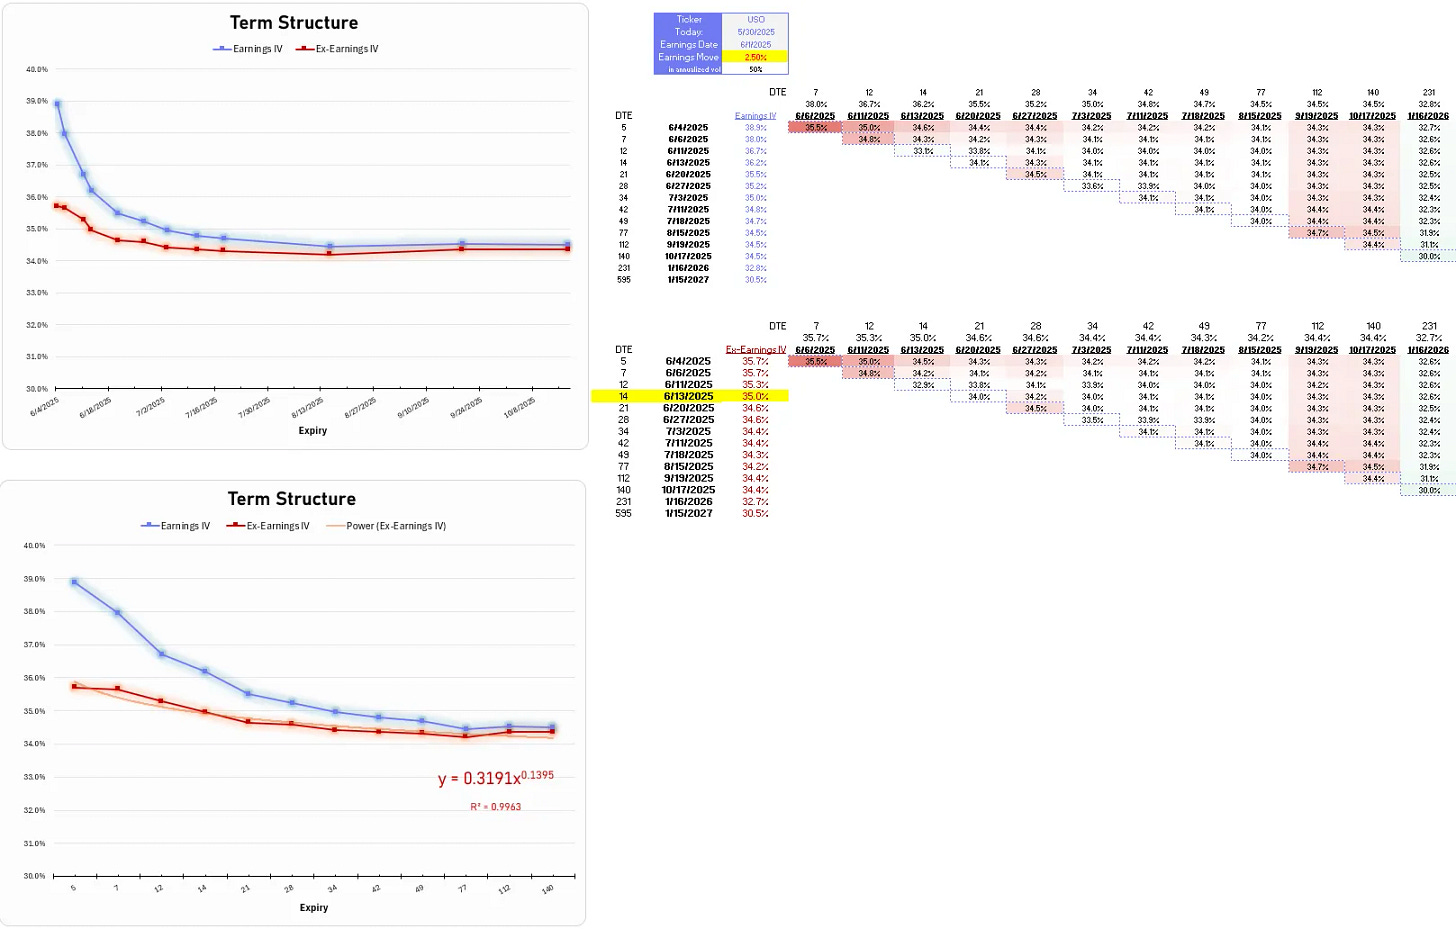
The smooth vol term structure imputes a dirty, event-extracted or base vol of ~ 35%
Let’s recap our expectations recalling that dirty vol closed on Friday at 36.2%
- We expected dirty vol to up to 37.4% to keep the clean vol unchanged net of the weekend effect. +1.2% expectation
- We expected dirty vol to fall to 35% once the OPEC meeting has passed. -1.2% expectation.
They cancel out!
On balance we expected the dirty to be unchanged on Monday at 36.2% to reflect a clean vol falling from 35.9% to the event-free 35% net of calendar effects.
We observe that the dirty vol actually increased to 37.3% so we can say that oil clean vol was up on the day.
If there was no event baked into the surface, our baseline would not be “clean vol falls on Monday” and we would therefore have said Monday’s vol was unchanged despite the dirty vols optically being higher.
💬Inserting my own comment
It’s not unusual to find this very confusing. Vol cleaning is a necessary step for professional vol trading. It’s the epitome of my measurement not prediction idea where much of the battle is just seeing the present clearly. “Is vol actually up or down?” is a hard question.
To get more grimy — think about earnings season where lots of single-name vols are higher because of upcoming announcements. If you simply tracked implied correlation across the year without normalizing base vols it would appear that they became extremely low 4x a year as stock vols increased relative to the index.
If you don’t normalize for events, then you need to compartmentalize what normal levels of implied correlation are inside and outside of earnings season.
You can start to understand why Tina is quiet about her own process. These processes vary across professional vol shops but what they all have in common is they have a process — you can’t trade high volumes for slivers of edge while being wrong about whether the vol is 25.1 vs 25.4.
The good news is for anyone else using options these differences are just brain damage. If you’re trying to trade for .3 vols of edge you're already cooked by your execution costs and broker funding rates. Long/short funds don’t try to trade for bps of edge anymore than option users should be trading for a quarter click.
Monday, June 2
Back to the main narrative.
On Monday, June 2nd we saw that the dirty vol opened up 1.2 points which coincidentally matched how much we think the clean vol was up. The ETF itself opened higher 4% — it wasn’t that the OPEC production hikes were bullish (as in they were less than expected) but that was the weekend the Ukraine drones surprised parked Russian bombers.
By the end of that Monday, oil relaxed to being up only 3% on the day and dirty vol for the June 13 expiry dropped to 35%. What clean vol is that by the end of June 2nd?
Dirty DTE = 11/365 ~ .03741
Clean DTE = 10/308 ~.03247
First, look what happened — after June 2nd elapses the DTE flips…there is much less clean DTE than dirty DTE now! It makes sense — when one business day elapses 1/308 rolls off the board in a clean model but only 1/365 elapses in a calendar day model. This happens all week as the dirty days increase relative to the clean days (and therefore the dirty vol declines steadily thru the week to keep the clean vol unchanged before sawtoothing up over the weekend again).
For a dirty vol of 35%, we know the clean vol must be higher because for a given option price we believe there is less DTE.
The algebra:
Clean vol = Dirty Vol * √(Dirty DTE/Clean DTE)
Clean vol = 35% * √( .03741/.03247)
Clean vol = 37.6%
Instead of clean vol falling to a base vol of 35% after the event, we see that it’s actually up to 37.6% up from 35.9% on Friday’s close. An increase of 1.7 points but 2.6 points vs our expectation of clean vol falling from 35.9% to 35% after the meeting. Hence the title of this post…”the dirties are down the cleans are up.”
NotebookLM
I fed NotebookLM both articles and that prompt from earlier.
You can see its work here.
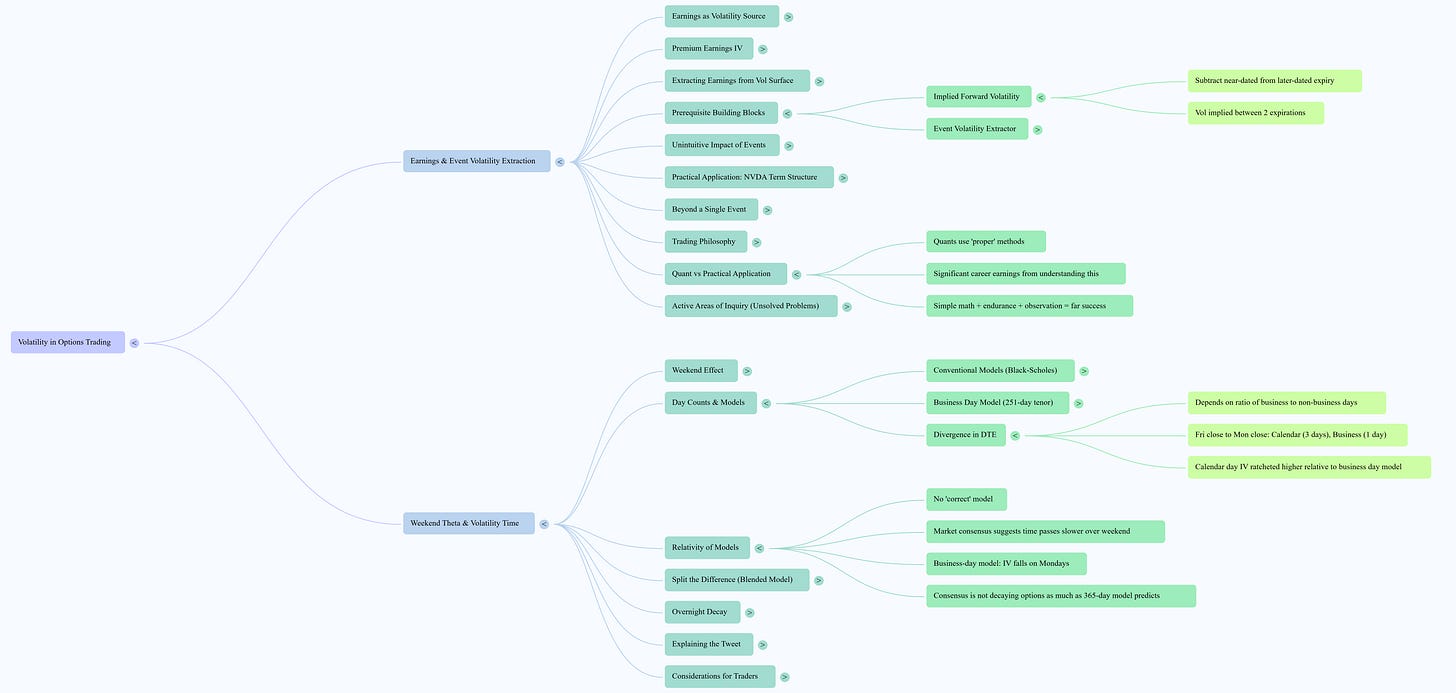
It’s a pretty amazing synthesis tool, auto-generating a study guide, briefing, FAQ, mind map and even a podcast so you can learn on the go (my interest in this was renewed as I’ve been listening to an auto-generated podcast by a professor friend on the topic of business education).
Some screenshots of Notebook LM:

The mind map with just a few toggles open:
That’s a wrap for today.