
the 80/20 hack for "risk-adjusting" returns
Forecasting your actual compounded return
In the ELI5 vid published this week, I explained how the options market provides a rich understanding of a stock’s distribution and therefore its risk. Using the chart below, I gave an example of 2 stocks, both $100, that had very different return profiles:
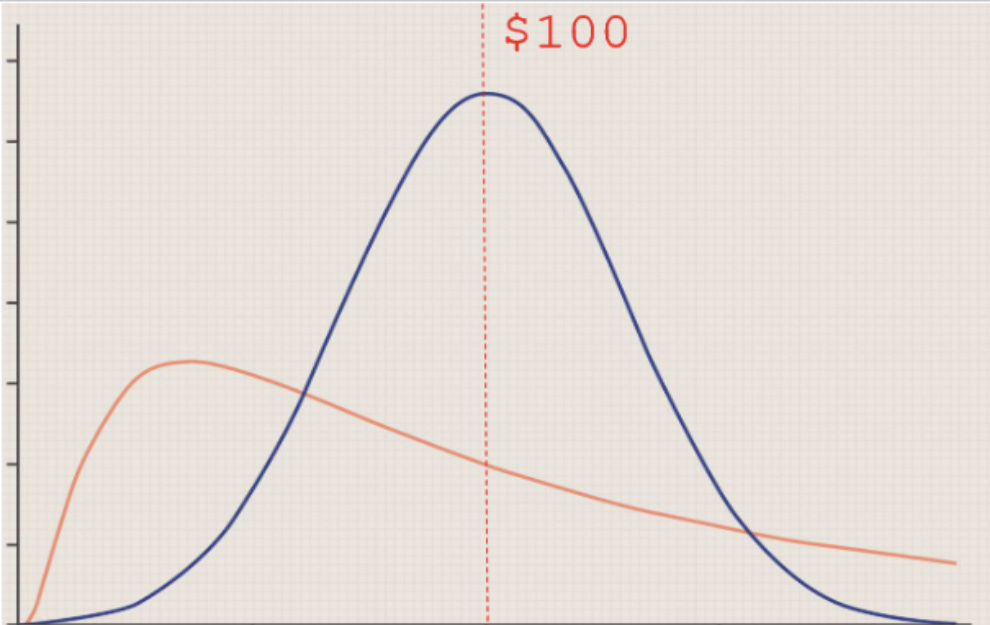
The orange stock has much more upside but it’s also far more likely to lose the bulk of its value. In the video, I explain how the option chain reveals this.
My friend Stefan texted me after watching it…
Kris. I just watched your video on stock options. Questions: you mentioned that the underlying options tell you if the stock prices is based on large skew/volatility and that you might not want to have the bio stock as half your portfolio. I own [redacted diversified index ETF] and [redacted risky tech stock]. How can I tell if either of these stocks are like the biotech stock example without doing the math or looking at the options? Is there any way to easily see or tool that tells me?
I’ll share my answer in a moment, but he got 95% of the way there in the text he followed up with before I even got to respond:
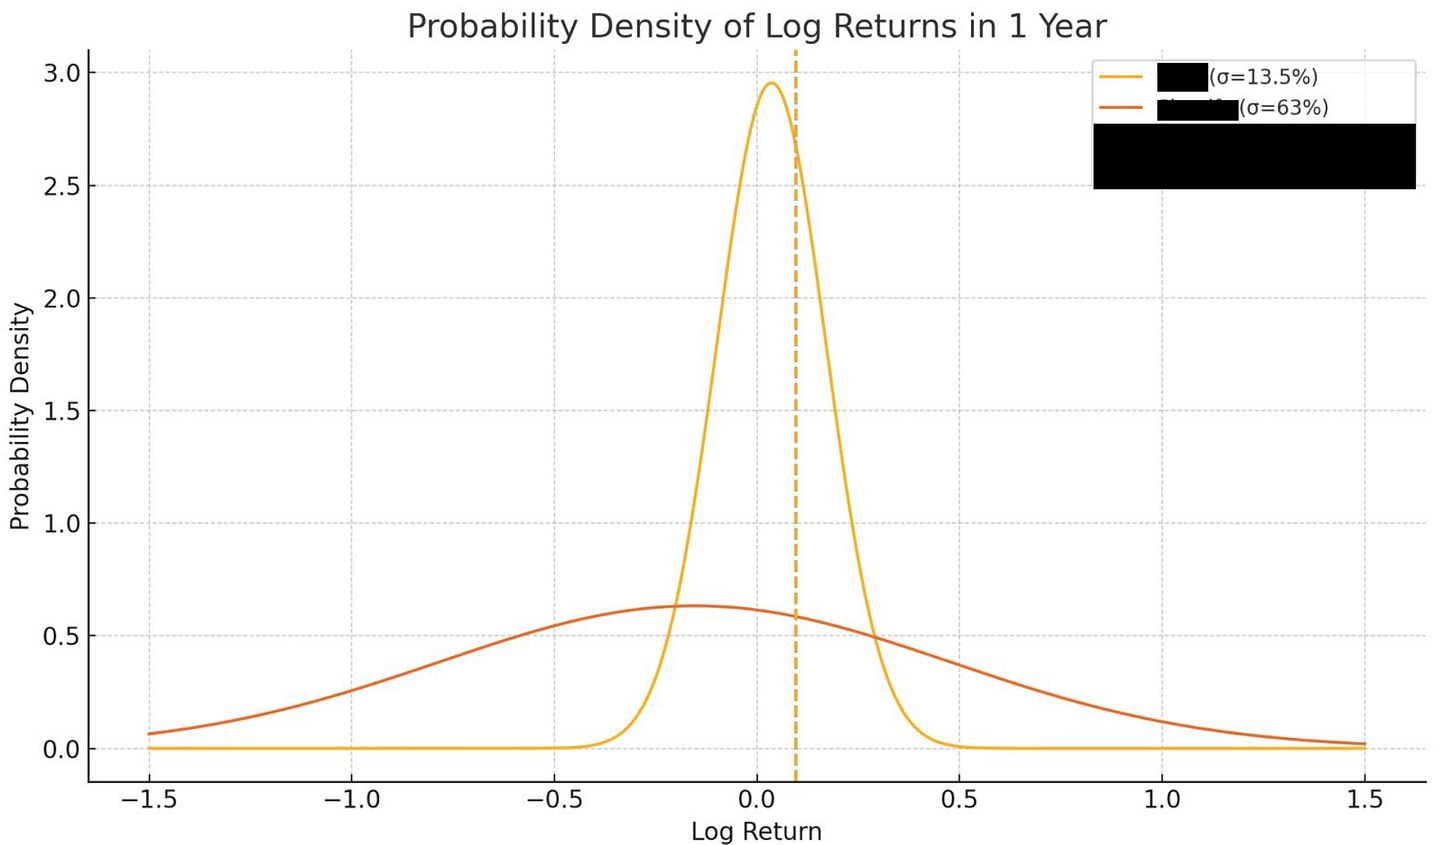
That was a chart ChatGPT gave him based on logreturns. The clue is the vol…diversified index vol was 13.5% and for the tech stock it was 63%.
Notice how the tech stock’s expected center of mass is well to the left of the index.
This is the 80/20 answer to the question of how can I tell the risk of some stock…just ask “what is its vol?”
You can pull that from the historical returns or from the at-the-money implied vol of say a 6-month or 12-month option. No need to examine an entire option surface.
This is very informative because your compounded expected return is highly sensitive to the square of volatility.
This was my text back to him:
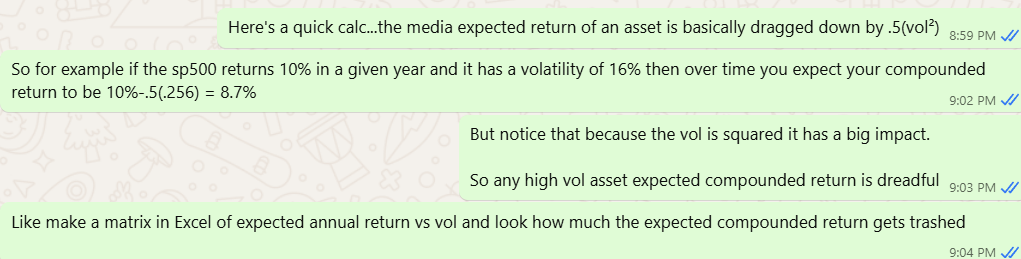
[I’m grateful that he texted me so I can feel like I matter, but really you can just ask ChatGPT while I kick rocks. Funny enough I’ve gotten texts where people show that LLMs cite moontower. A patronizing pat on the head before I’m fully ingested into the substrate of electric intelligence.
If you do care about more detail, see Geometric vs Arithmetic Mean in the Wild. Go to the heading called this is not just theoretical to see how actual results line up very well to the vol drag formula. This is the gravity of returns, which connects average return to the average return you will actually receive.]