Tax-Loss Harvesting On Levered Long/Short
tax loss harvesting
Real estate people understand the value of accounting losses in service of deferring taxes while an asset’s returns compound.
In the institutional investing world many investors such as endowments are tax-exempt.
Retail investors in public stocks have less places to hide outside of tax-advantaged accounts which are hard to jam lots of assets into in the first place.
The rise of ETFs have come with some relief on the tax side as you decide when to pay taxes because you decide when to sell even as the holdings are rebalanced. Mutual funds can leave you footing a prorated portion of the pool’s taxes regardless of how long you’ve been an investor.
While the ETF advantage is real it’s relatively minor compared to the ability to tax-loss harvest. By owning the individual components of a stock index you can sell losers, rebalance into peer stocks, and accumulate short-term losses to offset long-term capital gains on the subset of names that moon.
I say minor because of the “brain damage” (more effort, slippage, tracking error although if it’s random only matters if you’re managing money for others) and higher management fees associated with TLH. See Alpha Architect’s The Costs and Benefits of Tax-Loss-Harvesting (TLH) Versus an ETF.
Another restraint on TLH enthusiasm is limitation on writing off losses greater than $3,000 per year. Losses are more valuable in an NPV sense if you can use them to offset significant capital gains when diversifying out of a large gain in a concentrated position. With markets where they are, especially the Mag 7 and BTC, this is common high-class problem.
Still, the fintech world with the rise of robo-advisors and software is enabling both retail and advisors to “direct index” making TLH both easier and less costly.
Getting a sense of proportion
Let’s do some simplistic hand-wavey math to get a sense of proportion for how TLH might work if you were simply long a $1mm basket of stocks.
Assuming individual stocks were i.i.d. (“independent and identically distributed”) with expected mean monthly return of 0 and standard deviation of 10% (10% *√12 ~ 35% annual estimate of single stock volatility) then conditional on a stock being down its expected loss is 6.75%
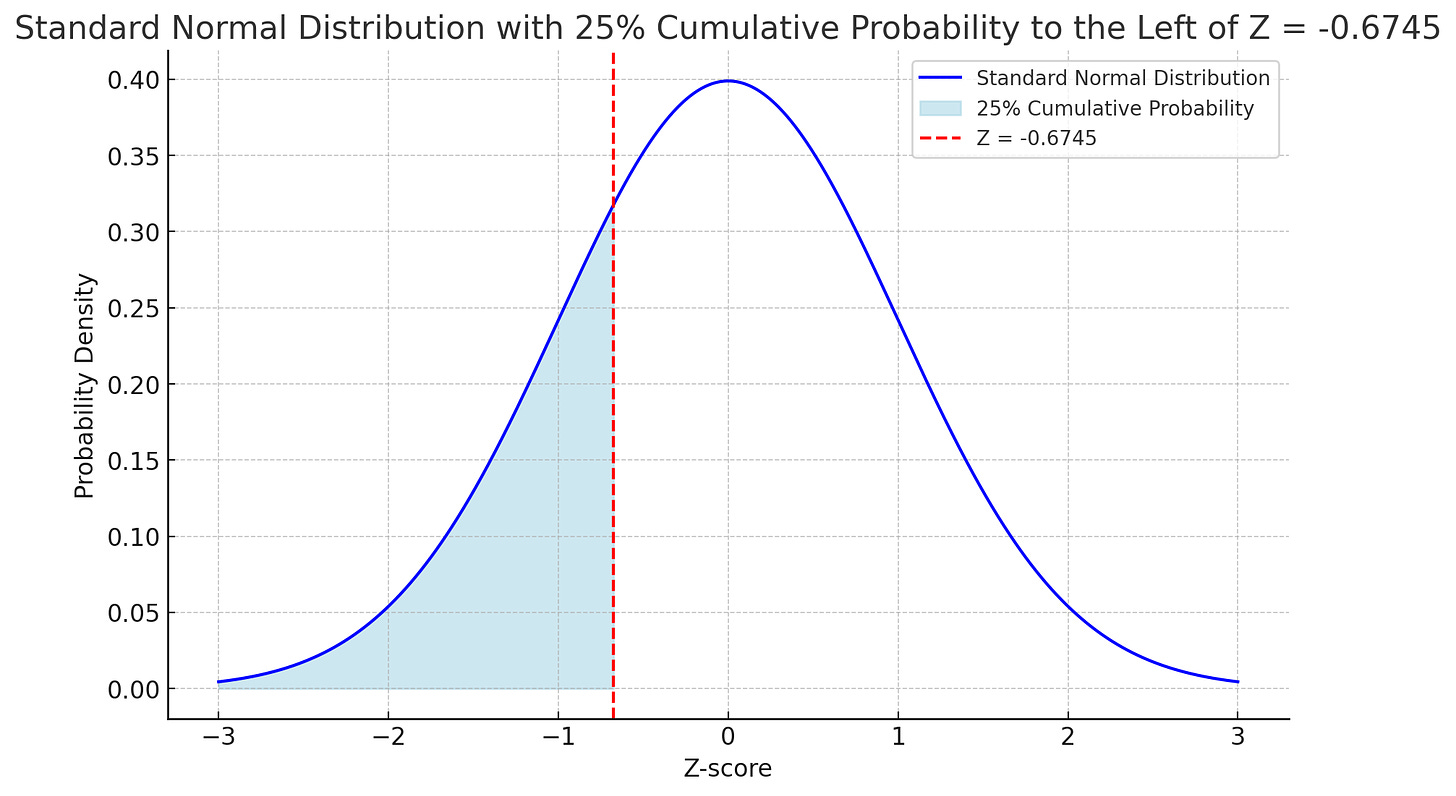
This is symmetrical. Given that a stock is up the average expected return is +6.75%. We are just using arithmetic returns.
In mathematical expectation you expect the portfolio p/l to be 0, with half the stocks up and half down. Thinking about the portfolio as 2 halves, you expect $500k to earn 6.75% or $33,750 and $500k to lose $33,750.
Now suppose you rebalance the losers into a Wario basket of names that have the same exact characteristics as the ones we sold. You have now crystallized $33,750 of short-term tax losses but our exposure is the same. You have gained an asset to offset future tax liabilities.
Just staying simplistic, if all the stocks proceed to go up by 5% over the next 365 days and you sell on day 366 to get LTCG treatment (assume 23.8% — which is just Federal!) then what is your after tax return?
Winning stocks:
$533,750 * 1.05 = $559,728.75 or $59,728.75 total profit on a basis of $500k
Losing Stocks:
$466,250 * 1.05 = $489,562.50 or $23,312.50 profit on a basis of $466,250
resulting in:
+$83,041.25 LTCG (5% on $1mm exposure)
-$33,750 short term losses
= taxable gain of $49,291.25
tax bill = 23.8% x $49,291.25 = $11,731.32
After cutting the check what do you have in your account?
$1,049,291.25 - $11,731.32 = $1,037,559.93 or a 3.75% after-tax return.
💡The tax benefit
You’ll notice that if you bought $1mm of an ETF that went up 5% in a year and sold on day 366 your $50,000 profit less 23.8% taxes would net you about the same after-tax return.
So where’s the benefit?
It’s in the optionality of this pool of short term losses that you have control over. You could just let this $1,050,000 portfolio grow and keep the short-term losses as an asset in your back pocket to use against future tax liabilities, some of which are going to be taxed higher than LTCG rate. Alternatively if you need to divest a large chunk of a profitable position to raise cash, you’ll have a large pool of losses to offset the gain.
The real value of TLH emerges when:
- Offsetting Higher Tax-Rate Gains
- Short-term capital gains (STCG) or ordinary income are taxed at higher rates than LTCG. If your harvested losses offset STCG or ordinary income, you reduce your taxes significantly.
- Perpetual Deferral
- Step-Up in Basis
- If you hold the portfolio until death, the heirs may receive a step-up in basis, erasing deferred taxes entirely.
- Charitable Contributions:
- Gains on low-basis positions can be avoided by donating appreciated securities to charity.
- Step-Up in Basis
This toy example is compelling enough to realize it’s important. But there’s also another flavor of TLH on the scene with the potential to generate significant short-term accounting losses while the overall value of the portfolio grows.
TLH on levered long-short portfolios held in a separately managed account (SMA)
Using portfolio margin and a quant framework (this can range fairly basic to factor-intensive), an investor can run the same beta they desired in a typical long-only ETF but generate significant short-term losses by using their stocks as collateral to overlay a long-short portfolio.
This is typically done with an advisor who will in turn be using a sub-advisor whose infrastructure allows them to scale portfolio adjustments across thousands of custom custom portfolios held in SMAs.
I’ve heard some claims of how much more impactful this can be but again it’s critical to sanity check with actual numbers to make sure the sense of proportion is reasonable. From there you start layering common caveats which are easier to handicap in terms of bps per year.
In this case, the sanity checks called for simulation.
A little foreshadowing — if you are in a high tax bracket or trying to work out of a concentrated position with a low cost basis you are going to want to see this.
You get the simulation code, you can run it in your browser and it will even download the full output. I’ll show you a few manipulations for the output so you can get a strong grasp on the mechanics. This is one of those concepts that you can’t unsee once you see it. Multiple bulbs going on at the same time.
(It’s also quite depressing so much time is spent on taxes and the ROI on that time is validated by the math. Both taxes and the time spent on their minimization is deadweight loss. I like markets, I hate structuring and law and tax and basically all the crap that’s probably higher yield to understand. And just going through this exercise depressed me even further because it confirmed how important it is.)
Onwards…
This Jupyter notebook can be run directly in the Google Colab environment.
Open the link and press “play”.
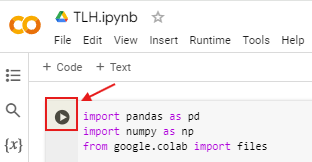
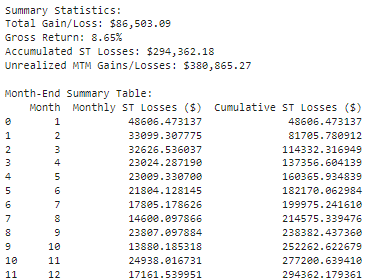
The output will:
Return a summary in the browser of the simulation results
download a CSV to your browser

Stepping through the tax-loss harvesting (TLH) simulation
This simulation models a tax-loss harvesting strategy applied to a hypothetical stock portfolio over a 12-month period. The objective is to demonstrate how TLH can potentially reduce taxes by systematically harvesting losses on individual stocks while maintaining the portfolio’s market exposure.
Key Steps and Mechanics of the Simulation
- Portfolio Setup: $1mm long equity portfolio
- The portfolio consists of two parts:
- Long Positions: $1,300,000 allocated across 100 individual stocks.
- Short Positions: $300,000 allocated across another 100 individual stocks.
- Each stock in the long portfolio has a starting price of $100 and is equally weighted. Each stock in the short portfolio also has a starting price of $100 and is equally weighted.
- The portfolio consists of two parts:
- Return Simulation:
- Every month, the returns for each stock are randomly and independently generated based on a normal distribution with:
- Mean Return: .80% per month (approximately 10% annualized compound return).
- Volatility: 10% per month
- Every month, the returns for each stock are randomly and independently generated based on a normal distribution with:
- Monthly Rebalancing for Tax-Loss Harvesting:
- Harvesting Criteria: At the end of each month, the simulation checks each position to see if it meets the tax-loss harvesting criteria.
- Long Positions: If the price of a long stock falls below its cost basis ($100), the position is “harvested.”
- Harvesting Process:
- The position is closed, and the realized loss is calculated based on the difference between the cost basis and the current price.
- This loss is recorded as a crystallized loss, and the realized loss amount is added to the cumulative short-term losses for the portfolio.
- A new stock is bought in its place with a fresh cost basis of $100 using the harvested amount. Since the original position suffered a loss, the proceeds will be less than $13,000 ($100 * 130) worth of shares. Since the new stock is also $100, the share quantity must be less than 130.
- Harvesting Process:
- Short Positions: If the price of a short stock rises above its cost basis ($100), the position is similarly harvested.
- Harvesting Process:
- The position is closed, realizing a loss based on the difference between the cost basis and the current price.
- This loss is recorded as a crystallized loss, and the amount is added to the cumulative short-term losses.
- A short position in a new name is established to match the notional amount of the covered position. A fresh cost basis of $100, but the short share quantity will necessarily be less than 30 shares.
- Harvesting Process:
- No Harvest for Profitable Positions: Positions that remain above (long) or below (short) their cost basis are not harvested and continue with their updated prices and fixed share quantities into the next month.
- Tracking Results:
- For each month, the simulation tracks:
- Monthly Short-Term Losses: The sum of all realized losses from harvested positions within the month.
- Cumulative Short-Term Losses: The running total of all realized losses harvested up to that point in the year.
- Monthly Tax Benefit: Calculated as the monthly short-term losses multiplied by a specified long capital gains tax rate (assumed to be 23.8%) since that’s what they will be used to offset.
- Cumulative Tax Benefit: The running total of tax savings from all harvested short-term losses over the year.
- For each month, the simulation tracks:
- Assumptions:
- Consistent Cost Basis: Each new position, whether long or short, always has a fresh cost basis of $100, regardless of the prior stock’s price at liquidation.
- Monthly Frequency: The portfolio is evaluated and rebalanced for TLH at the end of each month, meaning opportunities to harvest losses are considered 12 times over the year.
- Independent Stock Movements: Each stock’s returns are generated independently of others, with no correlation among stock prices.
- Equal Allocation and Reinvestment: Both the long and short portfolios are equally allocated across the stocks, and any harvested amount is fully reinvested into a new position with the same initial investment amount.
- Static Portfolio Size: The portfolio maintains 100 long and 100 short positions, with new stocks replacing harvested ones to keep the portfolio composition stable.
- Output:
- At the end of the simulation, the following information is displayed:
- Detailed Monthly Summary Table: Includes individual stock performance, crystallized losses, and other details for each stock every month.
- Month-End Summary: Shows monthly and cumulative short-term losses and tax benefits. This provides insights into how the strategy’s tax benefits accumulate over the year.
- Overall Portfolio Statistics: Total portfolio gain/loss, gross return, accumulated short-term losses, and the final tax benefit as a percentage of the initial portfolio value.
- At the end of the simulation, the following information is displayed:
Summary
I address a few of the real-world considerations further below.
But to put the value of this concisely:
Making a $100k capital gain on an investment is not as useful as making $300k with $200k of short-term losses even though the net is the same.
[Notice how you might not have enough capital gains to take advantage of all these short-term losses. Which is why a strategy like this is especially useful for investors sitting on concentrated profits — they can work out out of it much with smaller tax impact. Holdings can be used to collateralize shorts with portfolio margin!]
Real World Considerations
- In practice, a TLH strategy would seek to rebalance into names with similar characteristics (whether by factor, sector etc) to avoid wash-sale rules. In the simulation each stock has the same vol but this proxies using equal-vol weighting in the real world.
- There is a cost of leverage although it is partially offset by the short-stock rebate on shorts.
- Note that as the market rises, the number of positions that are underwater declines. Names you recently rebalanced into will have a better chance to experience loss to harvest than a name that you have been holding for years of a bull market. However the levered version of TLH which includes shorts and longs offers far more opportunity to harvest than a long only portfolio which might have very few losers after several years.
- As time passes the surface area for loss harvesting stabilizes towards something of a steady state.
- The strategy is meant to maintain a 100% long exposure (130 long vs 30 short) so if volatility increases it is still bad news. But the tax loss harvesting portion can actually benefit from higher volatility so there’s a natural buffer.
- Monthly turnover means slippage costs. Those will increase with volatility.
Wrapping up
I leave it to you to decide how interesting this all might be.
(I find it compelling but still taking it apart.)
I’m not a tax expert. I’m not a simulation expert. Hell, it was a long battle with ChatGPT to get that code to a place that felt right. (It was about 50 iterations of “run code”, “pivot table the CSV data”, “see if the lifecycle of trade/rebalance/accounting made sense”, “tell ChatGPT how the desired behavior of the code diverged from the actual behavior”, “repeat”).
Example of stitched together images of pivot tables to investigate:
- This one allowed me to see crystallized losses by month. You can see how they decline over time. That’s because as the market rises the further stocks are above their cost basis which means less opportunity for harvesting. This would be much more pronounced if there you did not employ shorting.
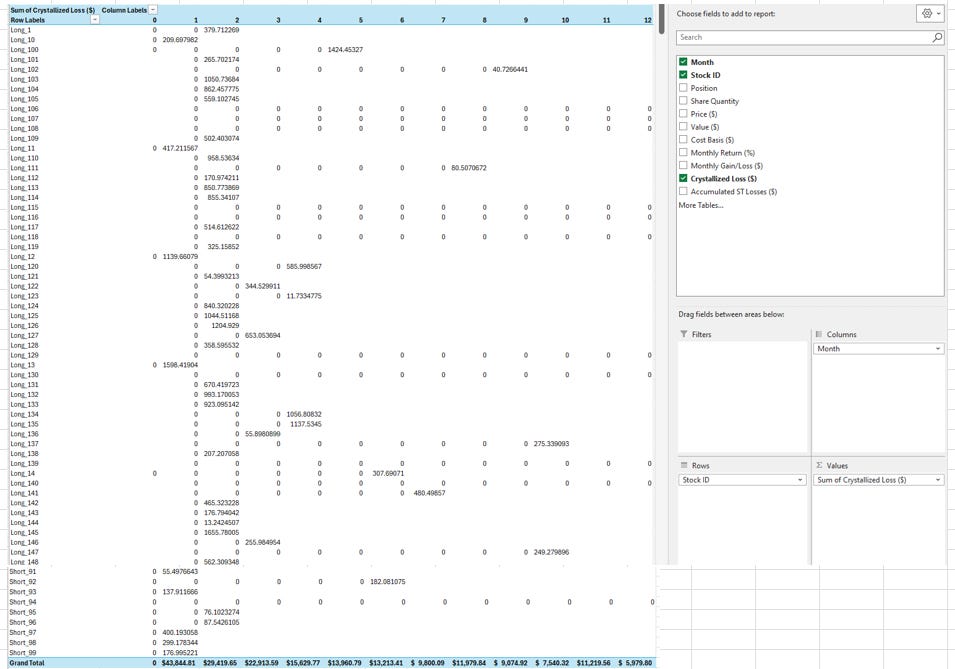
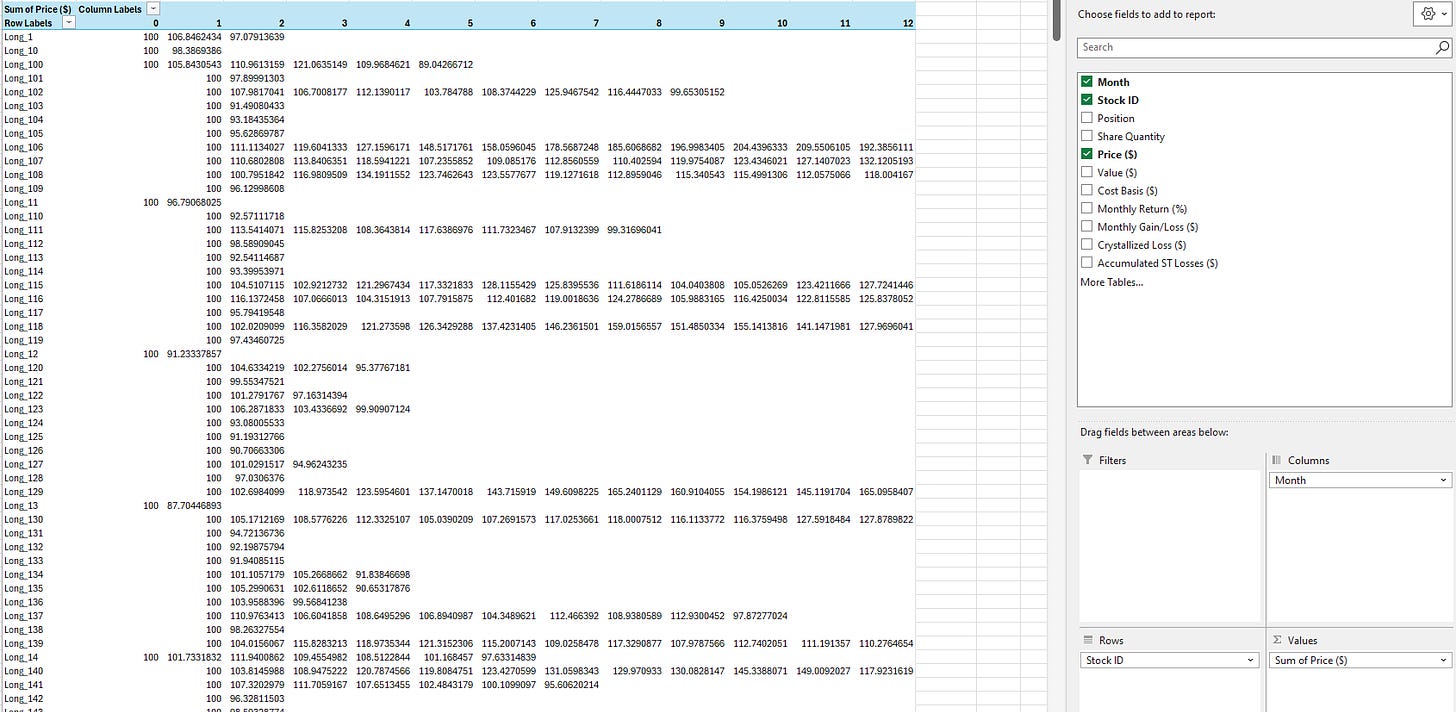
This table lets you see price paths
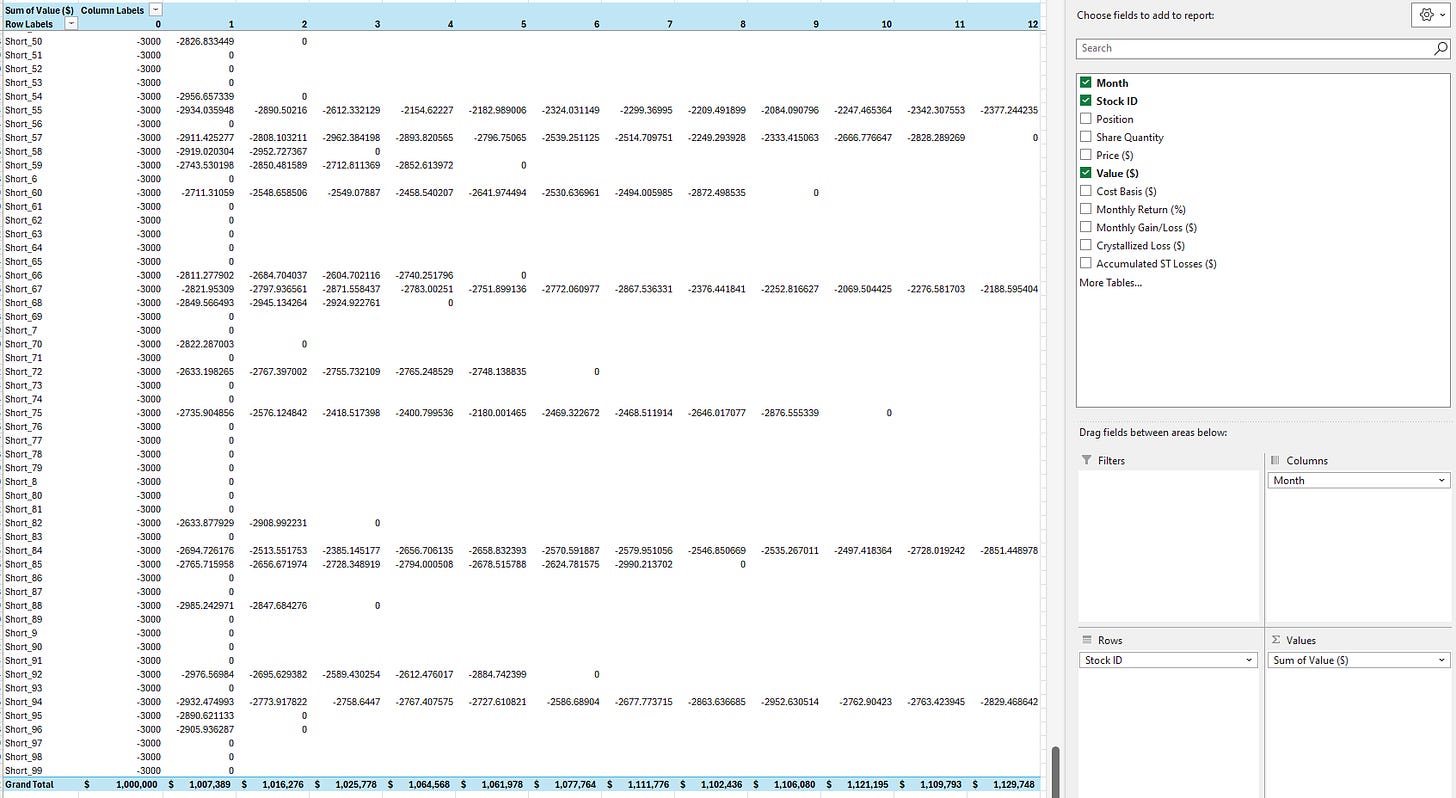
Position and portfolio values over time
I hope some of you will get your hands dirty with this as well. I want to know what I’m missing or flat-out misunderstanding. Even placing sane error bars around the real-world considerations would be helpful.
Stay groovy
☮️
