
straddle-sniped
stepping thru a COIN vol trade
I bought December COIN straddles yesterday, so instead I’m going to discuss:
- Premise
- Expression & Execution
- Management plan
- Miscellaneous aspects
[Normally, Thursday posts are paywalled but in honor of the upcoming Spring Break this one’s on the house. I’ll make it up to you paid subs I promise.]
Premise
Most people use options for directional reasons. A relatively small number of people use them because they have a view on vol. As I like to say, “Most investors have a view on a stock and assume the options are fair. Option traders have a view on the vol and assume the stock price is fair.”
Moontower.ai is built to help both.
If you are directional, then it allows you to marry your directional bias to the right option expression OR show you that the options are not a strong expression, suggesting you should just trade the underlying.
If you are the vol trader, the tools follow a funnel progression to lead you to possible vol trade candidates.
Today’s trade is an example of one from the vol trader lens. I bought COIN vol but have no view on the stock.
The progression:
First, the crypto sector has low implied vol compared to its own history while many other asset classes do not. So crypto is also low on a relative basis.
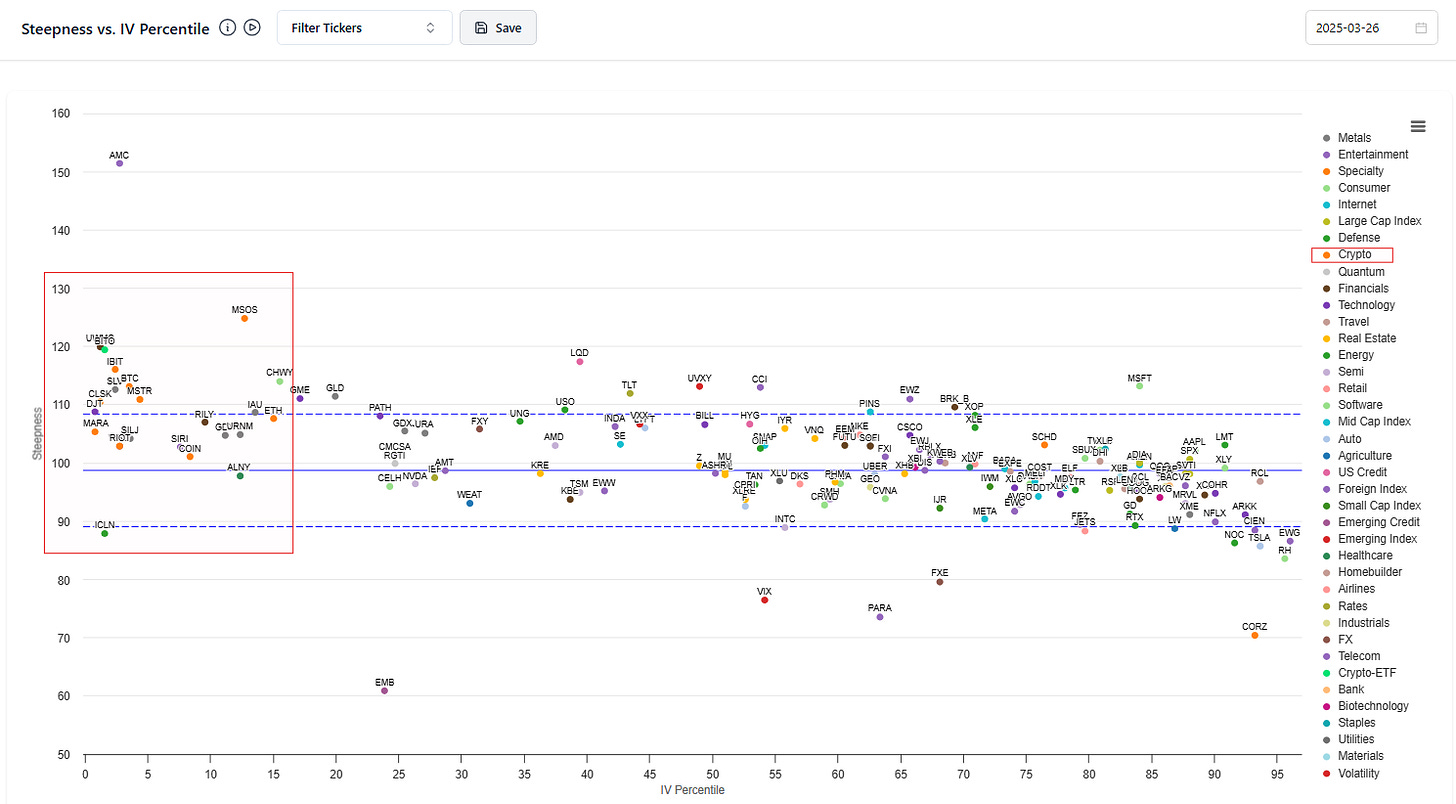
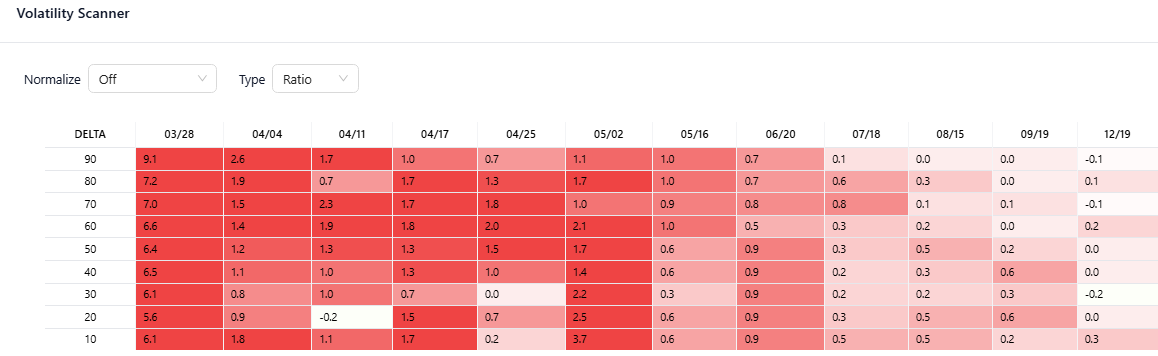
Zooming in on crypto only:
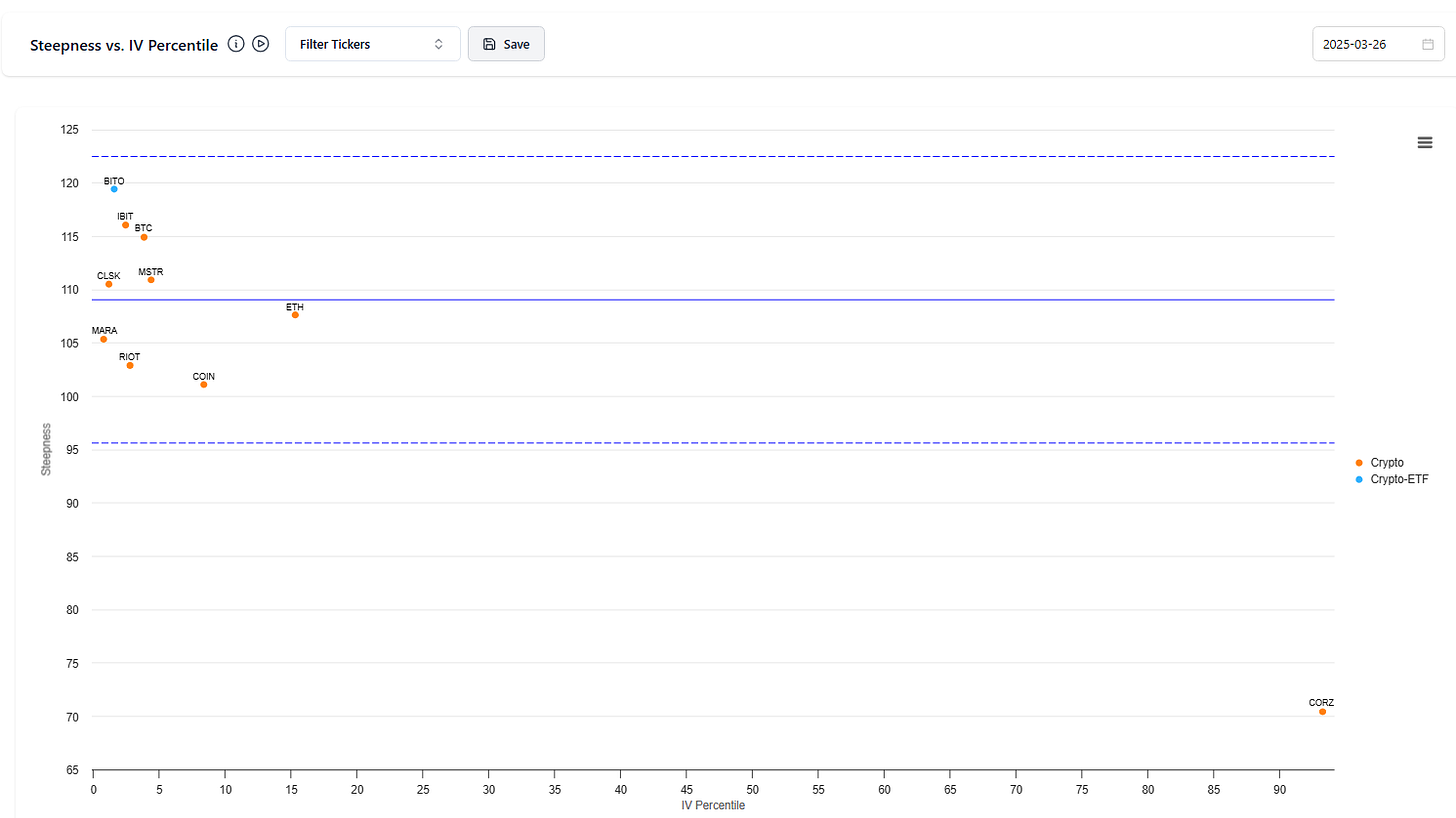
What’s interesting to me is that COIN is in a low vol percentile but also has a flat term structure. The steepness or ratio of 6m to 1m IV is flat. Usually, when vols get low, the term structure is ascending as you see in BTC for example. 6-month constant maturity IBIT vols are trading at a 1.16 ratio to the 1 month, which amounts to over 7 vol clicks. Looking at chain data (not constant maturity interpolation) it’s even steeper.
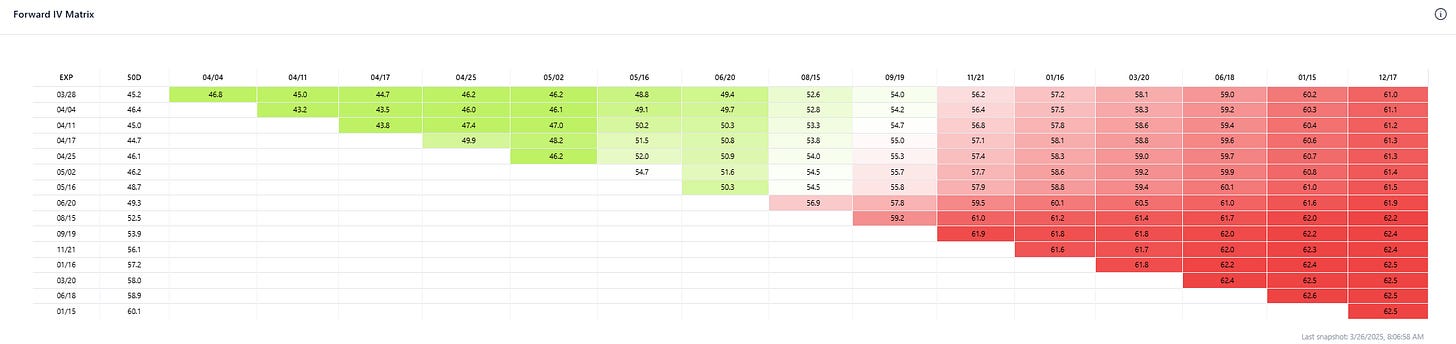
You can see the IVs on the left column with the implied forward vols in the matrix reflecting steep ascension in the term structure.
In COIN, we see the flatter term structure (although a touch steeper and noiser in chain data bc of earnings months)
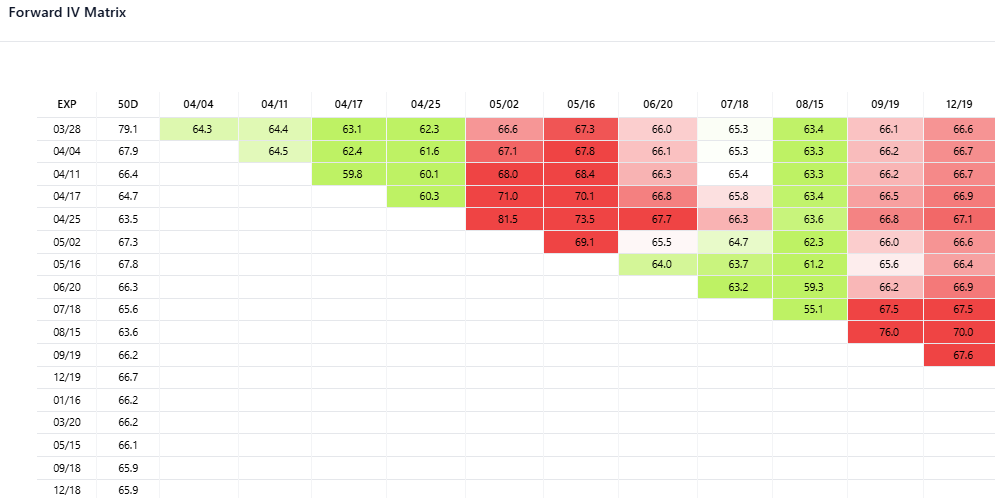
I’m not interested in a relative value trade here but I’ll circle back to that a bit later. I’m just pointing out that the flattish term structure in COIN is unusual when vols are low and something like BTC term structure is more expected.
Let’s focus on COIN by itself.
We know it’s in a low IV percentile, but there’s no notion of its VRP in that metric. How is the IV priced relative to how it moves? That’s the second step in the funnel.
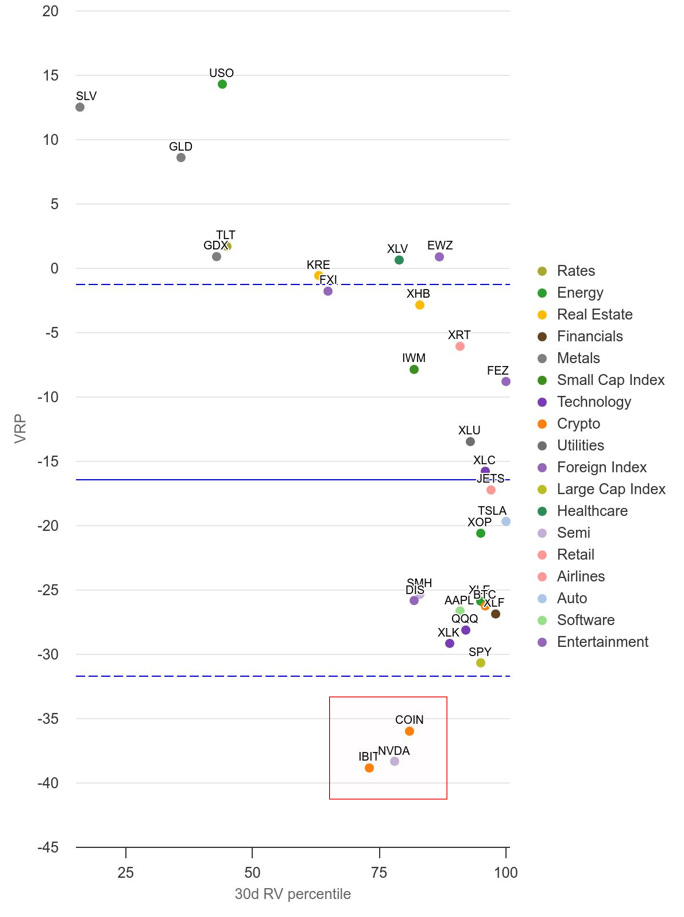
COIN like IBIT and NVDA have negative VRPs…they are moving much more than their implied vols (the ratio of IV/RV -1 is negative). However, we are coming out of an especially high vol period, those names have a realized vol that is in the 75th percentile so the market’s implied pricing says RV will relax. We can see that in the fact that the average VRP is negative across this watchlist. But these names are heavily discounted even beyond that.
So far, I’m thinking COIN is still cheap, but it’s not a smoking gun. Realized clearly has room to fall and that chart doesn’t give me a sense of how much.
Another view:
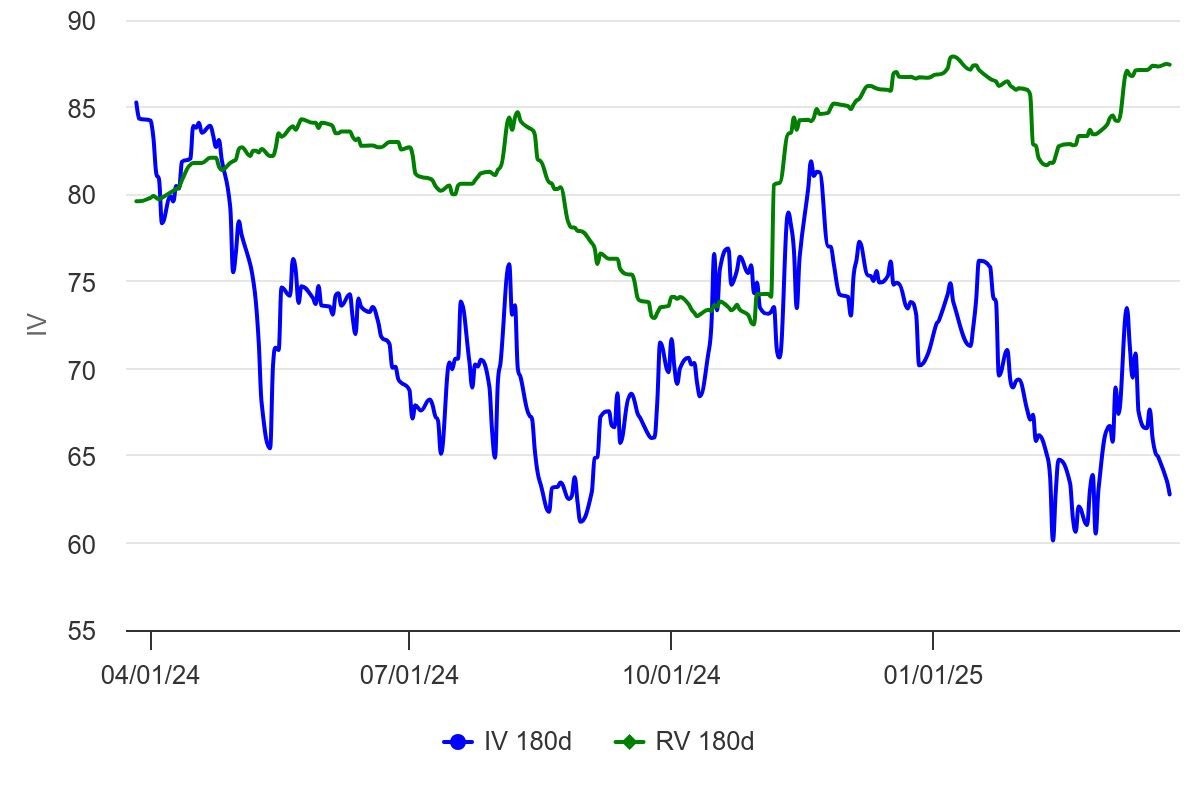
This is again using interpolated IV. It is very much on the low end of the range for 6-month vol. Admittedly, 180d realized is a very slow-moving metric and since it’s an overlapping time series (each day is the trailing 180), it’s low sample size. I like this chart mostly for the IV aspect, which gives us a sense of range and in this case certainly shows the low IV percentile.
Let’s look at the vol cone:
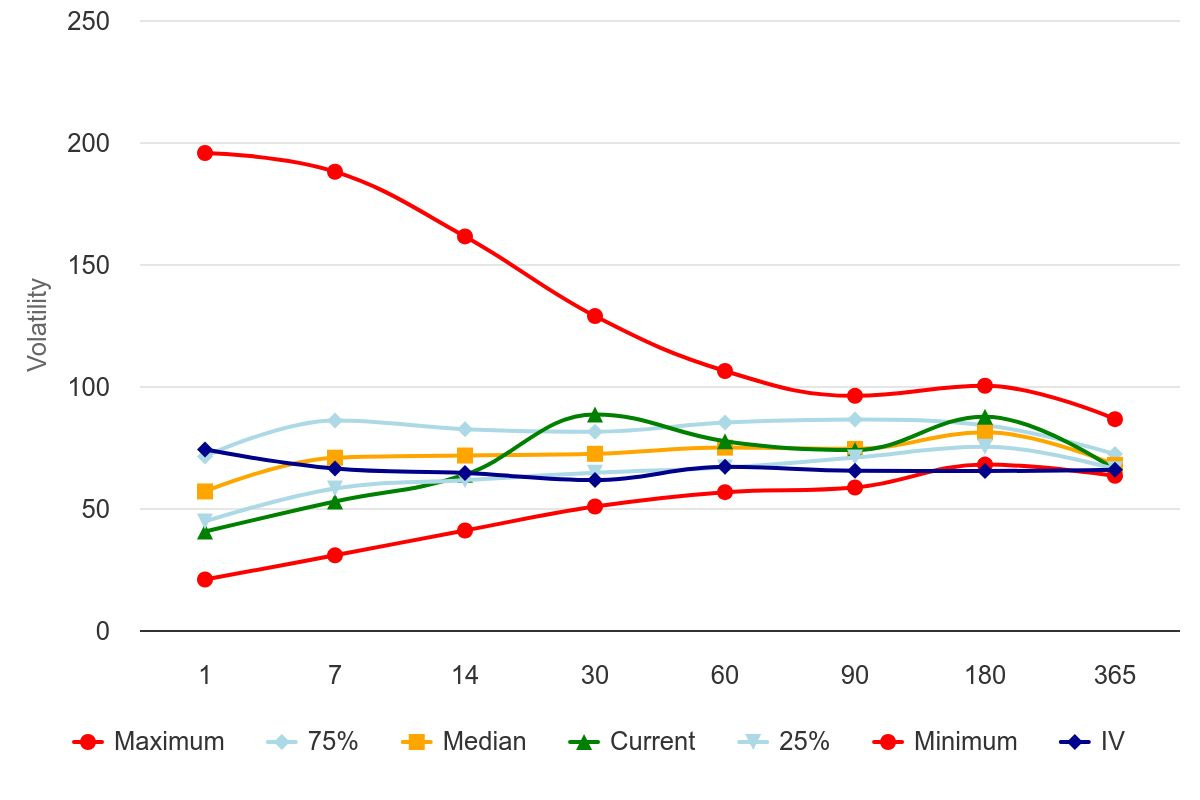
This chart shows you the distribution of realized vols sampled from daily readings at various lookbacks over the past 3 years. Again, the long lookbacks by their nature are low sample size since so much of their daily readings are overlapping. We superimpose the IV term structure through the cone.
That deferred IV is as low as the lowest reading of long-term realized vols. To be clear, we have certainly had 1 and 2 month periods where the realized has been lower than the mid 60s IV priced into the deferred vol, but they happen less than 25% of the time.
If you scroll through charts in this way, you typically don’t see vols that look low from all these lenses. This sticks out. That comment has a relative spirit behind it so it’s a nice segue back to a comparison with IBIT.
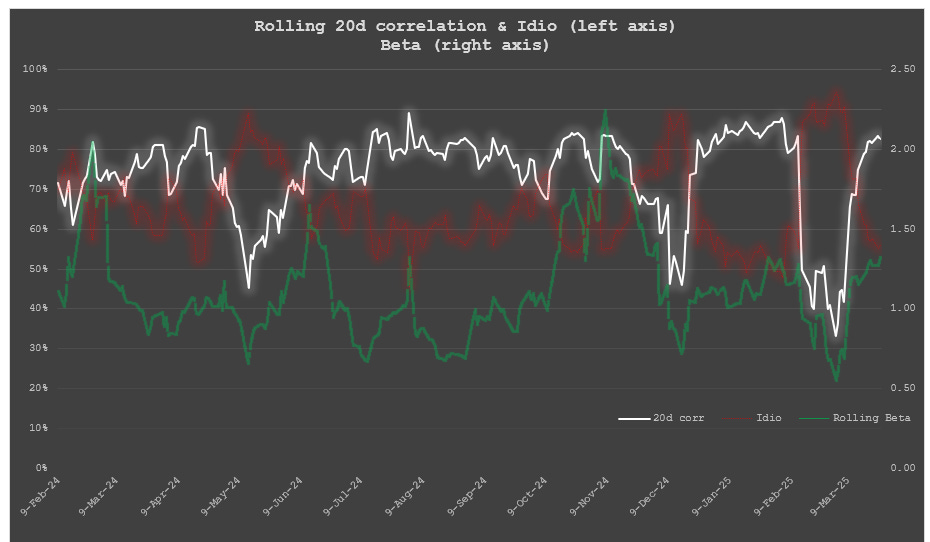
The December COIN IV is being priced at about 66 vol. Look at that IV compared with it’s 10d and 20d rolling RV history below. It looks quite cheap given the upside skew to the realized vol.
I also included IBIT’s realized vol. Knowing that the COIN Dec vol is about a 10 vol premium to IBIT Dec vol. It’s a small premium compared to how much COIN moves compared to IBIT:
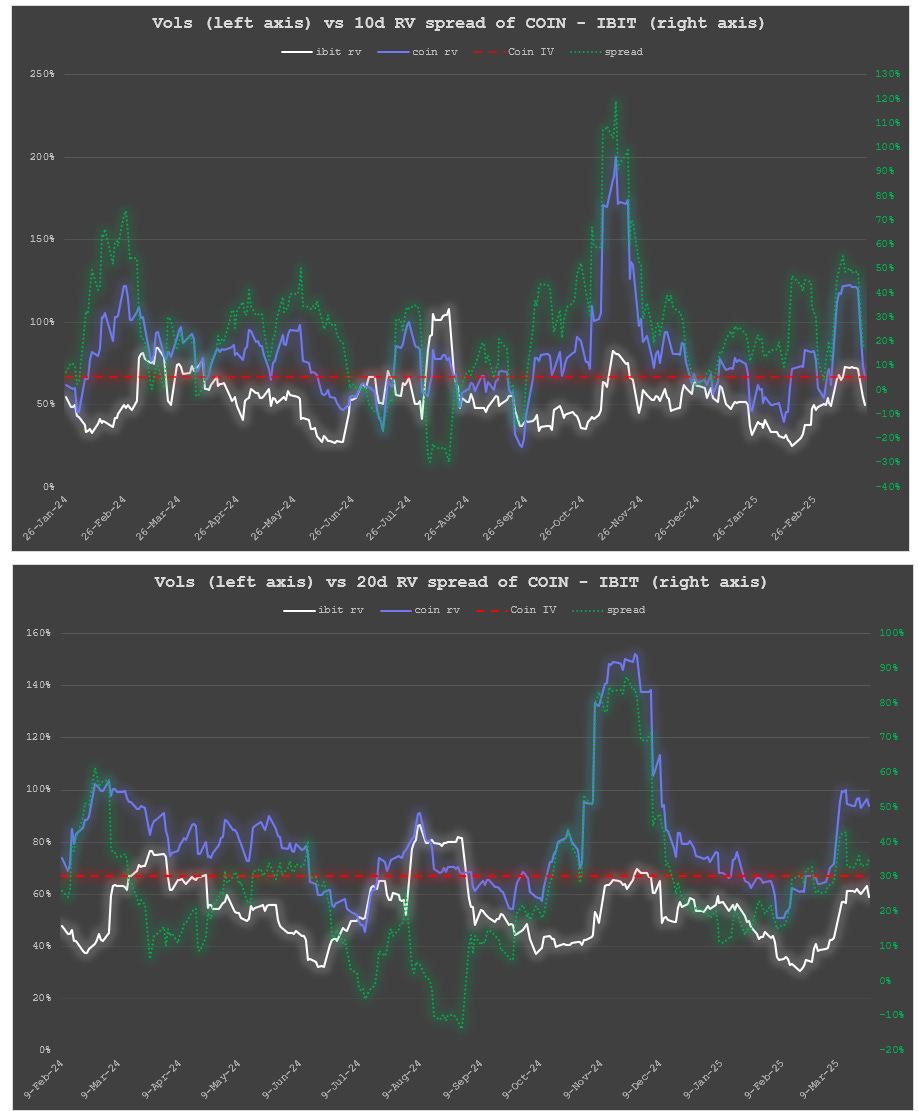
If you think IBIT vols are cheap, or even just fair, then COIN looks really cheap.
I don’t like the pair trade as there’s enough idiosyncratic risk in the relationship given how volatile the correlation is underneath the hood. This is also evident when, instead of looking at vol from daily returns, we peek at point-to-point total returns since January 2024 when IBIT was listed…COIN is up around 35% or close to half as much as IBIT is up, despite having a typical beta greater than 1 and being more volatile.
[“Idio” or what I was taught as “risk remaining” is how much of the vol in COIN is unexplained by IBIT. The formula is sqrt(1-R²). For more on that, see From CAPM To Hedging]
At this point, I like the COIN vol on its own. Now what?
Expression & Execution
The thrust of the trade:
Implied vol is cheap, I can “lock it in” further out in the term structure. There’s margin of safety in that it’s carrying well currently and the level is cheap enough that I’d expect it to carry well in most scenarios.
I think a fair vol would be somewhere around 72% based on median historical realized for the past 2 years (if I go back to 2022 the IV was much higher, but I prefer to be conservative…it’s stabilized since that crazy year). This also aligns with median realized vol using 30d lookbacks. I chose 30 to balance sample size a bit better but also because looking at longer periods makes the IV look even cheaper, and again, trying to be conservative. Low 70s is congruent with COIN having no VRP to median vol levels (although that hides lumpiness in the sense that the median realized includes earnings moves).
I have no major view on skew or direction and I want maximum exposure to vega and gamma. I’ll buy the 0 delta straddle.
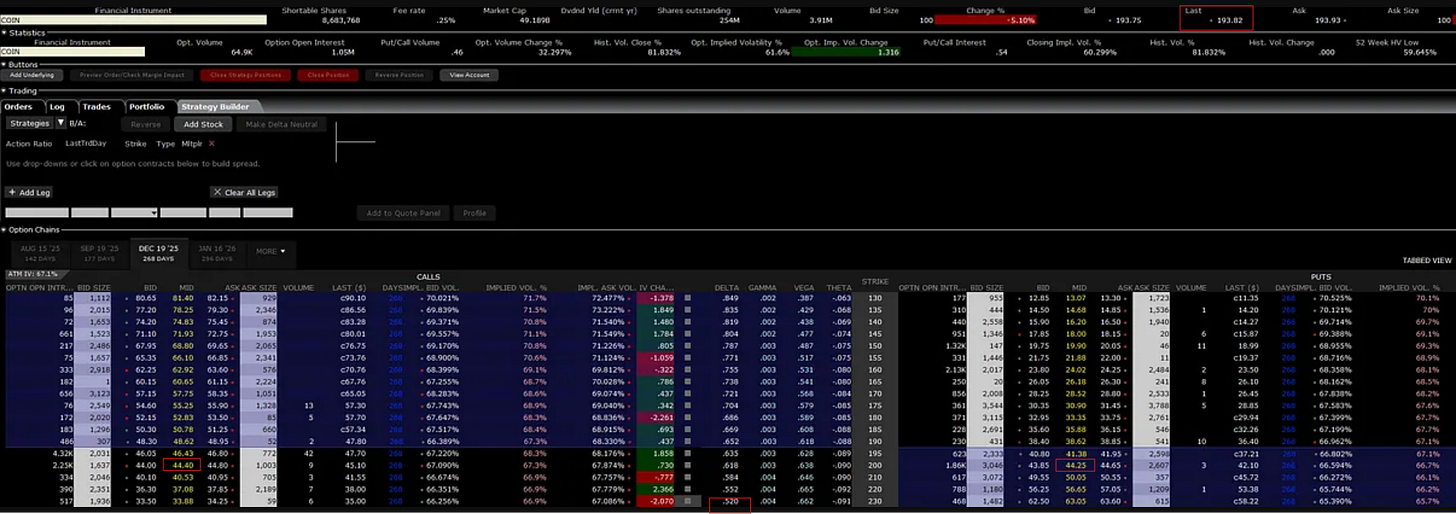
It’s a bit hard to see (try right-click “open image in new tab”) but I’ll point out noteworthy items on the December chain.
Stock price ~ $193.82
The first thing I do is check the implied interest rate. The 200 strike is where the call and put are almost equal so that’s the closest price to the synthetic future.
synthetic = call - put = $44.40 - $44.25 = $.15
implied synthetic future = strike + synthetic = $200.15
Since there are no dividends, the implied rate can be quickly estimated by:
($200.15 / $193.82) - 1 = 3.266%
Annualized:
3.266% * (365 / 268 DTE) = 4.45%
In line with the yield curve suggesting no hard-to-borrow issues, implied divs, or other carry “gotchas” which will taint IVs.
The 0 delta straddle, according to IB, is the 230 strike. The call is .52 delta, the put is .48, so the straddle delta is really .04
[If you are surprised that the .50d strike is $40 or about 20% OTM then review Lessons from the .50 Delta option]
Because the put is in-the-money and markets are nominally wide I want to compute what straddle price corresponds to mid-market for the call IV. When looking at a vol surface, OTM options are a more reliable estimate of implied vol relative to the ITM options, which will be wider because of extra delta risk market makers must cushion their quotes for. Plus, OTM options are naturally more liquid.
Mid-market on the call is 66.9% vol. A bit higher than the tools suggested which could be some lag or bid/ask sampling artifact. Vols in December are unchanged but overall vols were firmer today as COIN was down 5% or more than 1 st dev.
Fixed strike vol changes:
The Dec 230 straddle assuming 66.9% vol, the 4.45% rate we determined from the market itself, and a spot price of $192.82 using a European calculator, is worth $96.60
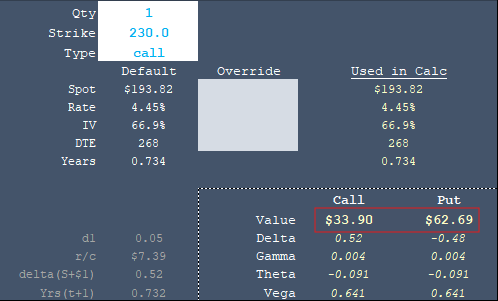
Mid-market on the straddle, which includes the noisy ITM put market,t was $96.93
I went through the hassle of computing the rate because I really want to know the implied vol I’m buying and you can’t just map the mid-market price back to mid call IV. You need a rate to use the calculator. This might not be obvious until you actually try to trade and then ask yourself what vol did I just trade? Whether you figure it with a calculator or using put-call parity in your head, you’ll realize you need to know the cost of carry.
So I want to buy the call’s mid-market vol of 66.9%
But I expect to pay slippage. 1/2 a vol point on such a vol level seems completely reasonable. The straddle vega is $1.28. Half a vol point is $.64
At 66.9% vol the straddle is worth $96.60
If I pay up 1/2 a vol point or $97.24 I am paying 67.4% vol.
I bid $97.25 to tip my local market maker. It’s a small trade, 5 contracts, or about $48k of option premium.
I got filled on 1 lot quickly.
And within 90 seconds…the balance.
I felt good I didn’t get hit on the whole 5 lots immediately. Old habits die hard.
If I think a fair vol is 72% that’s about 4.5 vol points or $5.75 in option terms. $2,875 in premium terms. Like I said, it’s a small trade. I have dry powder if it gets cheaper which is my preference right now, but I wanted a taste.
(I generally avoid single stocks so this was out of character…ETFs and commodities just feel way more familiar and I can situate that risk into my broader portfolio naturally. But this one was compelling enough to dabble in and document for an audience.)
Management plan
Managing the trade is in some ways the easiest part of the process. As I explain in this clip, I have a “day zero” mentality. I don’t care where I got in and what my p/l is. If the same reasoning process that led me into it, tells me to get out of it…either the vol appreciates too much or the rest of the “blob” gets cheap relatively then I’ll kick it out.
As far as isolating the vol, the trade size is well below my risk threshold so I’m willing to tolerate a fair bit of noise in “what vol I sample” so I may check on it once a week to trade some delta (the max delta of the structure is equivalent to 500 shares so we’re talking about odd lots most of the time).
Realistically, I probably won’t do anything unless it’s made enough of a move to make it worth trading 100 shares or heck, even more realistically, I might only trade the shares if my delta is short and I want to flatten (I’m underweight risk assets in general).
I hope it makes sense that my hedging strategy, or lack there,f has no bearing on the vol trade aspect of this. It only creates “tracking error” vs some platonic benchmark like “what if I hedged daily?”.
[I talk about this more in a misconception about harvesting volatility]
I’ll share how it’s going intermittently, and I’ll track any actions to do an autopsy when the trade is off the books.
Miscellaneous aspects
A smattering of thoughts in no particular order.
straddle vs vol thinking
As I discussed this in the Discord, a member said the straddle sounded expensive compared to the stock price.
This is a natural reaction. Option prices are highly unintuitive as you go out in time. They are priced based on some concept of integral or area under the curve of how much money you can make from flipping stock as it takes a jagged path from here to some distance that is probably not as far as the straddle price. Our mind sees the net distance but overlooks the nooks and crannies in the shoreline.
It’s almost like you unfolded a cube, looked at the sum of the perimeters and thought “that looks way longer than sum of the edges, sold!”
Not intuitive.
Conversely, thinking in terms of vol for straddles that have just a week or two to go is not necessary if you can reason about how much the stock can move. A common demonstration of this point is earnings. We think of the straddle, not the vol. The vol is irrelevant to our intuition because the realized vol vs theta battle will dominate the p/l decomposition not the change in IV. Short-dated options are all about dollar gamma and what gets realized. After all, we all know IV will fall after earnings but the only relevant question is “how much is this sucker gonna move?”
This dichotomy, the “particle/wave” of options — “is it a straddle or is it vol?” is not something you find in the textbook. It’s just where the gambling instincts bleed into the theory of replication.
[I feel a bit deficient saying so considering how long I’ve thought and dealt with this stuff, but at the end of the da,y I’m just like ‘sometimes these concepts resist easy sorting at the practical level so let go and live with some paradox’. Options trading is moving pictures, not photographs. I’m sure there’s mathematics that reconciles it all, but it’s not the language of thought for most of us.]
I do wonder if deferred vol cheapness might be structural because of some “price stickiness”. The straddle just appears too fat compared to the stock price. Another reason could be some collective market brain grokking the idea that if you sample vol over longer periods than daily it tends to be lower, so a seller, less exposed to gamma risk, can be a bit more aggressive. But if this were a universal idea, I’d expect to see instances of ascending vol term structures.
takeover risk
One of the major gotchas in single stock vol is the risk of a cash takeover which assasinsates extrinsic option premium. I don’t see that as a material risk given exchanges like ICE and CME are only about twice the size of COIN.
In a stock takeover where the acquisition shares are swapped for shares of the acquirer, options on the acquired shares will reference the acquiring company in the correct proportion. Larger companies are typically less volatile/more diversified so while not as disastrous for a long option holder as cash, vol still gets crushed in the target name.
COIN itself is in talks to buy Derebit which has the largest market share for crypto options.
That seems like a good place to close. I’ll follow up when I adjust the position.