
shadow theta
continuation of the discussion on time spreads through the eyes of a vol trader
Today is a continuation of calendar spreads through the eyes of a vol trader.
Recap
That post is a response to a conundrum that regularly presents itself to vol traders. These scenarios will feel familiar:
Harvesting VRP: "buying a time spread to harvest the front-month VRP" - selling expensive implied against cheaper realized while hedging with back-month options
Buying cheap vol: Vol screens low across the board, but front months are cheaper than back months. Do I buy the cheapest or pay up for duration?
Despite these situations being as common as dust, they don’t have an obvious playbook.
[Which is good because the moontower app has a point of view on this — because this is exactly the type of question you wrangle with when you run a vol book.]
My favorite approach to problems like this is not a backtest but a simulation. A sim is a controlled environment where you can fix assumptions, push a random variable, and get a platonic result that says “this is the shape of the p/l if the assumptions hold”. That might sound simplistic, but if you can’t forecast the output of the platonic case then you can benefit tremendously from some calibration. I predict you’ll benefit.
Understanding the simulation
The simulation approach I introduced uses a strike-resetting model to isolate vol realized vol’s contribution to the p/l — the variable you are betting on when you trade VRP. We initiate the stock at $100 then draw a return from a random walk of X vol. We compute the daily p/l of a portfolio comprised of:
a) the 100-strike calendar call spread (notice it is at-the-money)
b) a share position so that you start each day delta-neutral
So if the draw is +2% then we compute the p/l of the portfolio based on a stock price of $102 and time elapsing one trading day. We then reset the stock to $100 and repeat until M1 expires. We do this to minimize the noise of p/l path dependence that can occur if the stock gets far from the strike, choking off the dollar gamma in the process. In our sim, the dollar gamma starting each day follows the predictable glide path determined only by the DTE falling.
🔢Simulation Parameters
- DTE for M1 and M2
- IV for M1 and M2
- Realized vol to sample daily changes from
In the earlier post, I stepped through 2 examples of buying the calendar spread for a flat IV (ie M1 IV and M2 IV are equal) and the IV is greater than the realized vol (ie positive VRP).
You expect to win in this scenario because you are short gamma and collecting theta while the realized moves are not large enough to punish the seller. The rent or “cost of gamma” was too high for the counterparty who owns M1. For the calendar spread owner, they lose on being long M2 but not as much as they gain on being short M1.
Now I gave 2 examples to highlight that the trade is indeed noisy because there is so much gamma on the last day before expiry that it can make or break the entire p/l.
Today’s post will not only address the noise but the starting approach to the question:
How do we evaluate the term structure premium when either harvesting VRP or getting long cheap vol?
🤖Included in the post is a webapp to let you run a single or thousands of simulations and step thru any single trial day by day to understand exactly how the p/l develops as well as the p/l distributon for the entire batch! You can even clone the app to modify it as you want.
Let’s start hacking away on the questions of whether we should be buying calendar spreads to collect the VRP.
The day after I published the original post I sent out the simulation webapp I vibe-coded with Gemini. It allowed you to put the IV for M1 and M2, input a realized vol, and step through the daily hedged p/l until M1 expires.
Tinkering with that is useful because it gives you a sense of the noise in harvesting VRP. But it’s just a single trial of “hey I put this calendar spread on and hedged it until M1 went away, what happened?” (again, assuming spot resets to $100 daily)
What you’ll find is if you buy the calendar spread for flat vol and the realized is less than the implied, you usually win. If you pay a higher IV in M2, you win less or if you pay too much you actually lose.
Why?
Because the simulation embeds IV “rolldown”:
If M2 differs from M1 we assume a linear glide path for M2 to approach M1 by the time M1 expires. For example, if M1 has 20 dte and is 20% while M2 is 22%, then M2 vol will fall by .10 per day (2 vol points / 20 days).
This is a good place to stop to consider the forces driving a long calendar spread p/l:
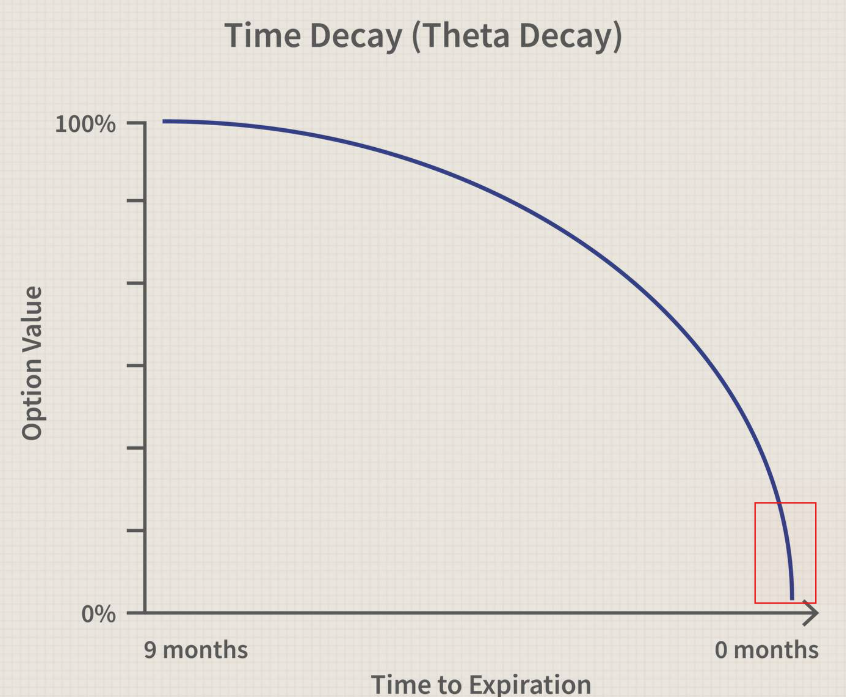
- You make more money the fatter the VRP — the theta rent you collect is more than compensating you for short gamma. To be more specific, you lose to your long option theta but more than make it up on your option theta. The theta and gamma of the longer dated option are both smaller than those of the nearer dated.
- If you pay a premium IV for M2 and it “rolls down” to IV of M1, then you lose to vega a little bit each day by the quantity vega * vol change.
Your p/l performance tradeoff looks like this:
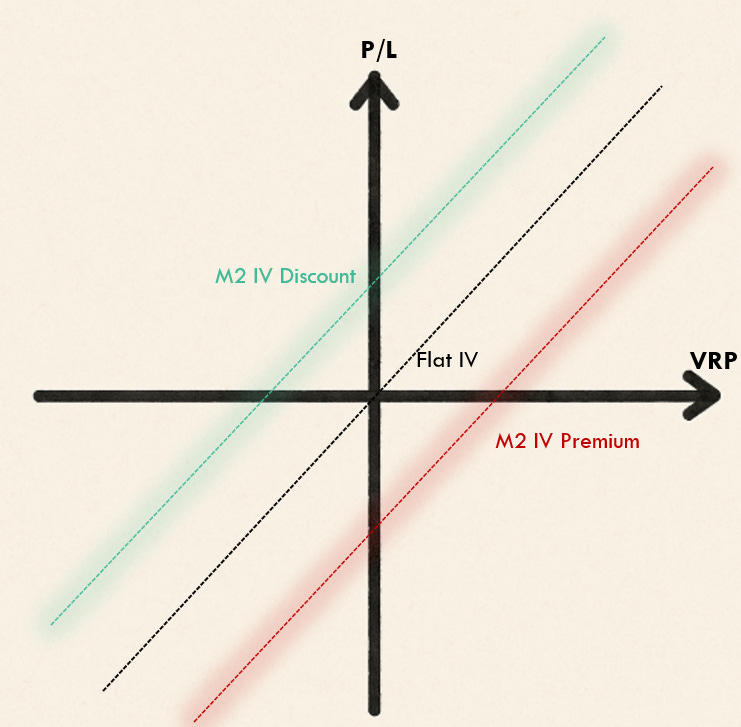
For a given VRP, you make more money the cheaper the calendar spread is. This is highly stylized, it’s basically a scribble— the true tradeoff curves may not even be lines.
“Shadow” Theta
In our simulation, M2 IV rolls down to M1 IV which is held constant. We can allocate the vega p/l loss to a descriptive term: “shadow” theta.
[I first heard of shadow greeks in Taleb’s Dynamic Hedging. I’m not referring to his definition of shadow theta, in fact I don’t remember if he had that one, but borrowing the nomenclature “shadow” which did get traction as a way to informally describe p/l sensitivities not already covered by the proper greeks.]
In the simple accounting for a calendar spread, M2 has less theta than M1. But if we expect M2 IV to roll down, then its effective theta will be its Black Scholes theta + shadow theta.
If M2 is a large enough premium to M1, M2 will actually have more theta than M1 until M1 gets close til expiry. You can still win being long such a time spread because if the stock only makes very small moves compared to its IV as M1 expiry approaches you will collect the larger M1 theta just as it hits the steeper section of its decay.
Equipped with shadow theta to account for roll down (or roll up in the event of discounted M2 IVs) in calendar spreads where M2 vol does not equal M1, we can interpret the latest simulation tool.
Built with Claude the new app runs the same delta-hedged process I showed earlier using Gemini, except now we have wrapped that simulation in a loop where we can run N trials of different random walks sampled from the same volatility.
The output allows provides 2 key views:
- the distribution of p/l’s for the whole batch
- a drill down into the path of any single trial
I recommend tinkering with it yourself, but let me offer a few examples of scenarios to run.
Run your own time spread simulations
Try it here:
🤖Monte Carlo Delta Hedged Simulator
Allow me to get you started with an example and some interpretation.
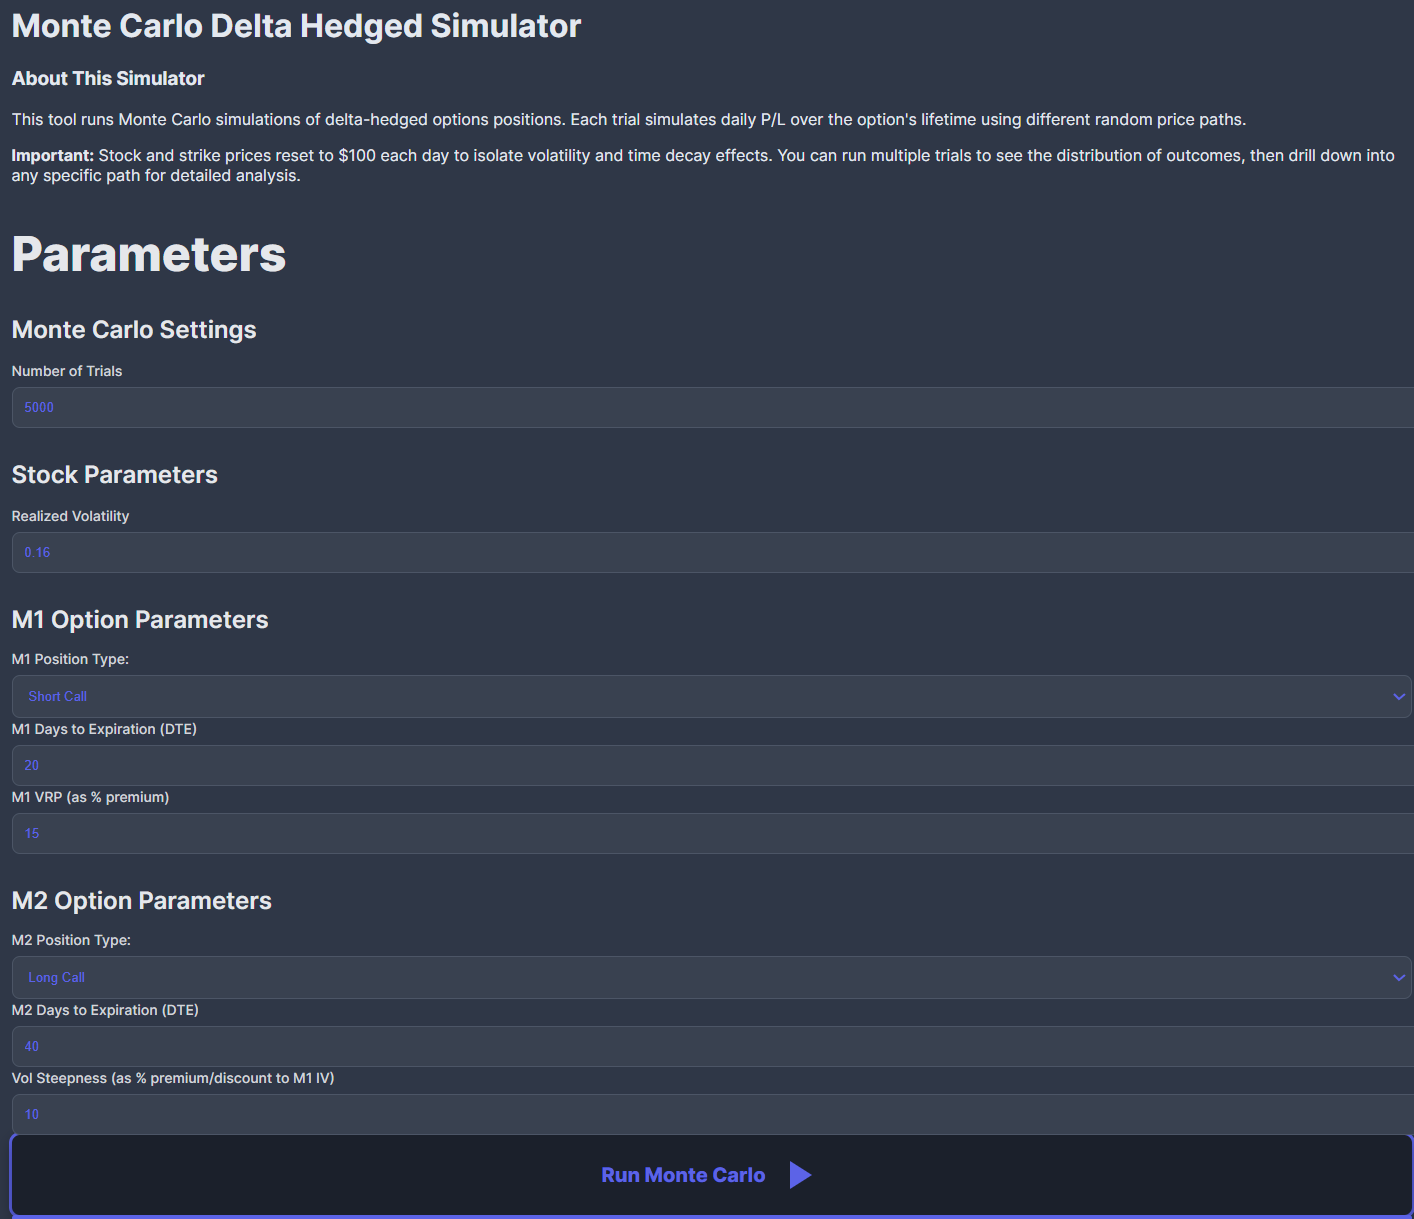
Typical market environment
# of trials: 5000
M1 position type: short call
realized vol: .16
M1 DTE: 20
M1 VRP as Percent Premium:15
M2 position type: long call
M2 DTE: 40
Vol Steepness (as % premium/discount to M1 IV): 10
Let’s translate the meaning of these value.
- The position types are describing a short ATM call calendar spread. The stock and strike price are both $100. The rfr is assumed to be 0.
- The 20 DTE and 40 DTE terms are chosen because they act like a 1-month/2-month spread (assuming trading days)
- The stock’s returns are being randomly chosen from a process assuming 0 drift and 16% annual vol, corresponding to ~1% daily vol.
- The M1 IV will be the VRP percent premium tacked on to the realized vol. In this case, IV = .16 * 1.15 = 18.4%
- The M2 IV comes from applying a “vol steepness” to M1 IV. In this case , IV2 = 18.4% * 1.10 = 20.2%
The simulation will then produce a return stream for 20 days (until M1 expires) and hedge back to delta-neutral daily as M2 vol “rolls down” linearly over those 20 days from 20.2% to 18.4%
That is 1 trial path. The output for that trial will show the cumulative p/l for the trade but you can examine any single day in the path (very educational to step thru btw).
When you run the simulation it will actually run 5000 trials and provide summary stats of the p/l distribution.
Let’s run this sim and go through the output.
Setup:
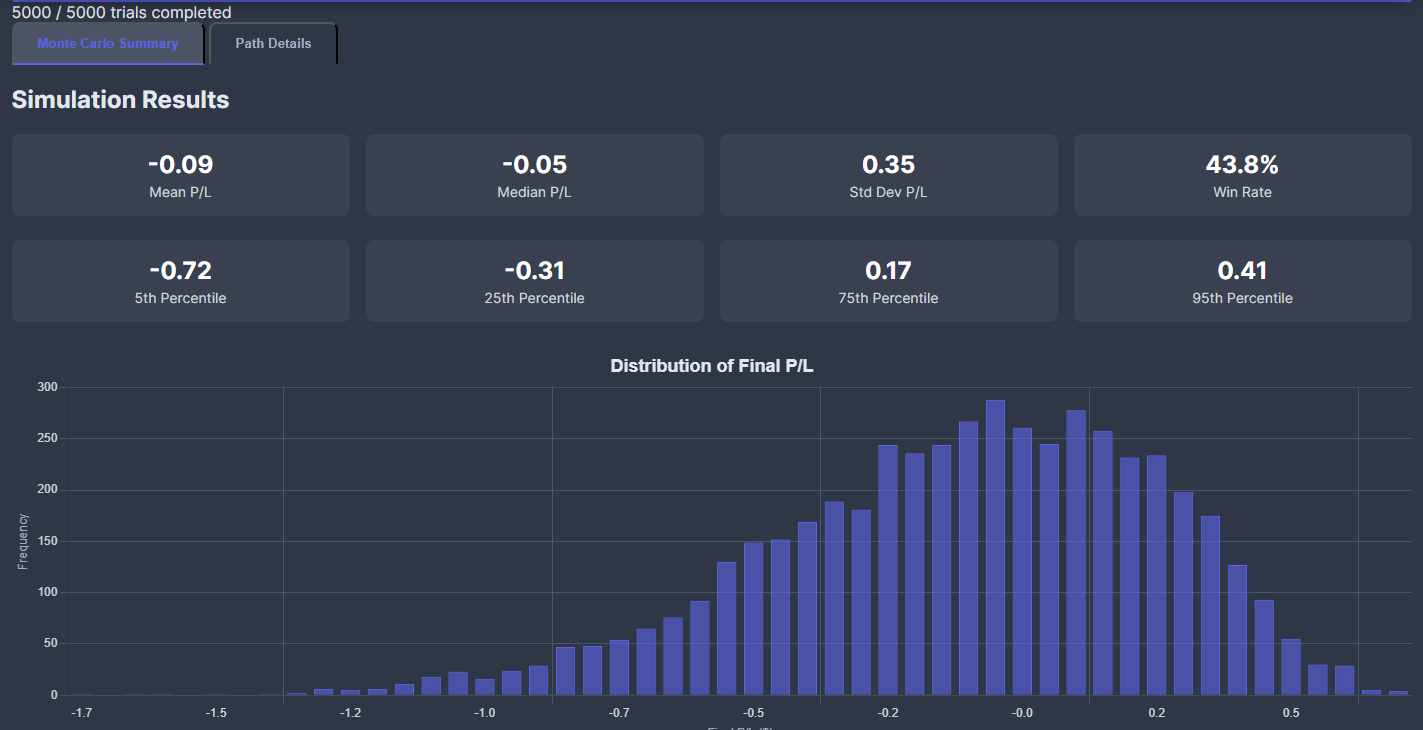
5000 trials…the trade has a mean p/l of -.09 with a st dev of .35 (so -.26 sharpe). It wins 44% of the time and a skewed left tail. It would perform better presumably if the VRP was fatter or if it didn’t have to pay a 2 vol point premium for M2. This lays the groundwork for the next sim a tinkerer might want to run — “What M2 and M1 were the same vol so there was no IV rolldown, how does that look?”
Let’s do it. New sim parameters:
Positive VRP, flat term structure scenario
# of trials: 5000
M1 position type: short call
realized vol: .16
M1 DTE: 20
M1 VRP as Percent Premium:15
M2 position type: long call
M2 DTE: 40
Vol Steepness (as %): 0 ←—— We changed this from 10 to 0!
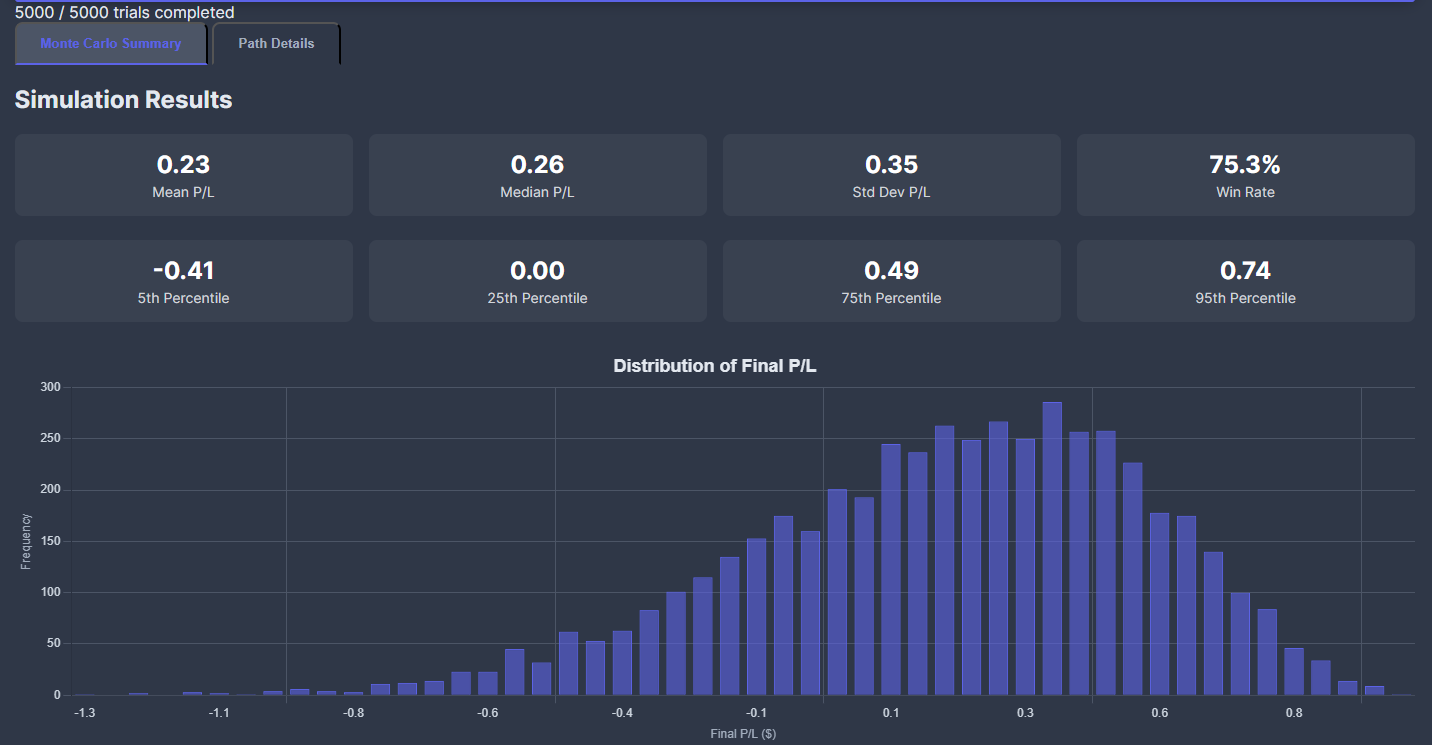
Now we’re talkin! We win 3/4 of the time, .66 sharpe and while the left tail extends to a larger magnitude, the right tail has more mass.
It’s instructive to look at the details of any single trial out of the 5000 runs.
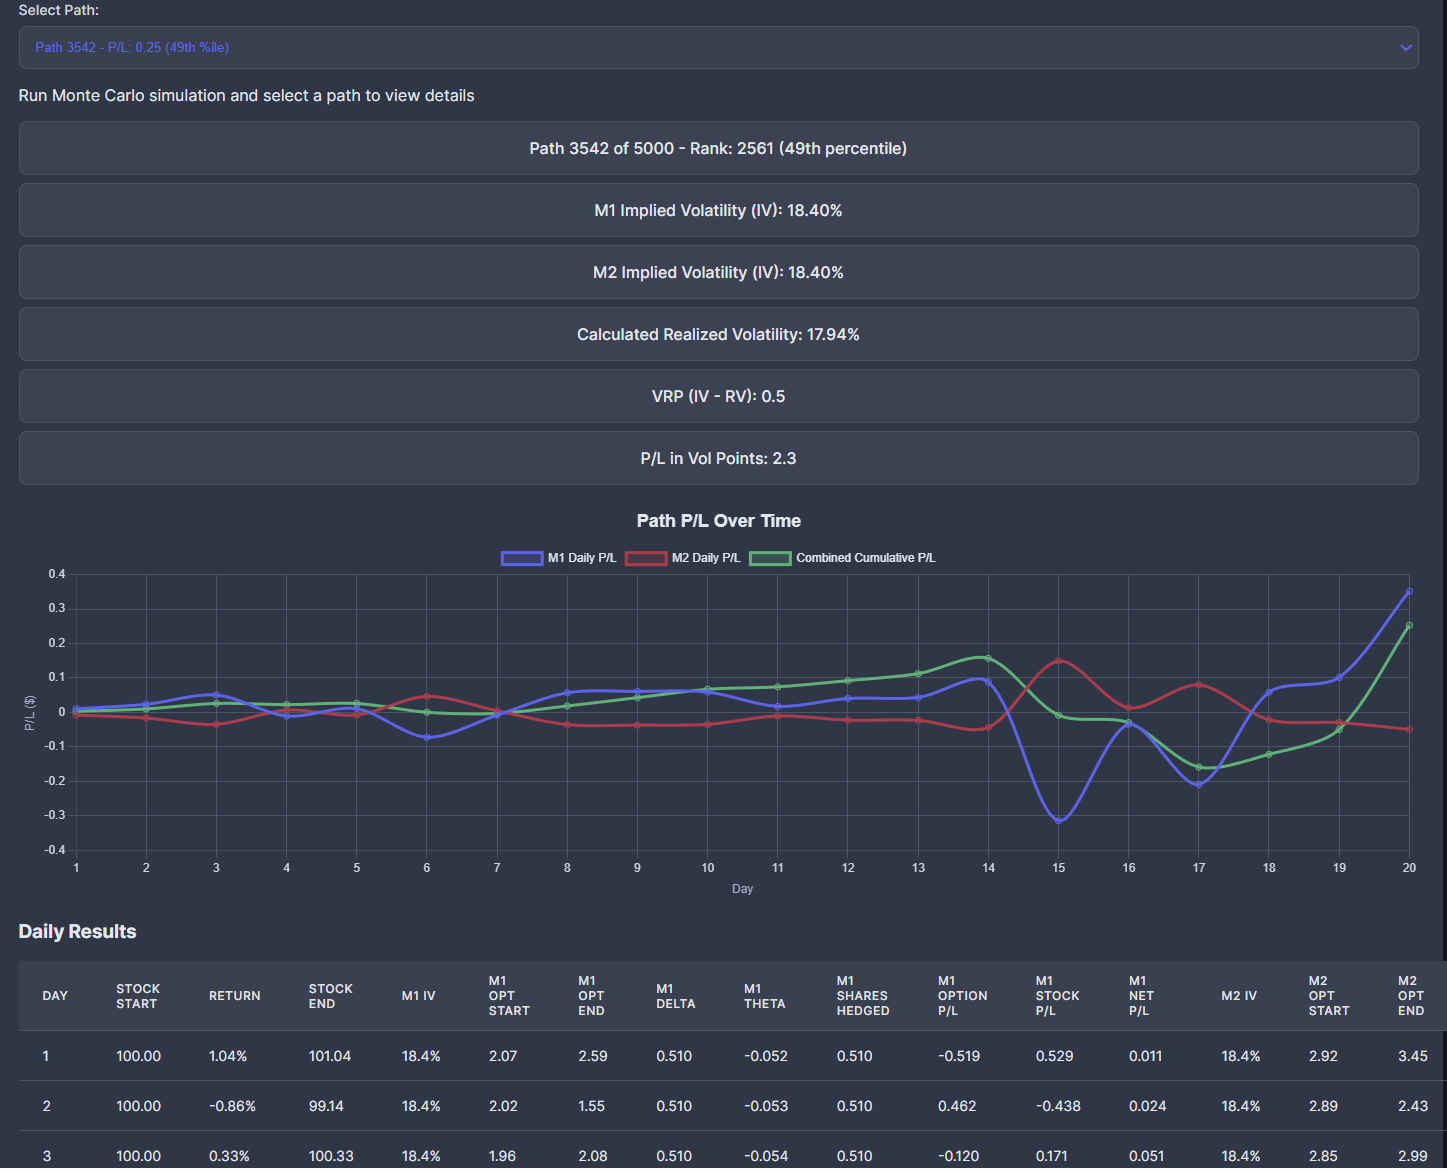
The table showing each day is larger than I can show in the screenshot but includes “shadow theta” and every other variable that goes into the computation so you can learn it yourself. (You can even make a copy of the app right from the UI if you wanted to customize it).
In the path summary, you can see that even though we draw returns from a 16% vol distribution, this particular trial of 20 trading days realized 17.94% vol, about 1/2 vol point realized VRP — however the path resulted in the trade earning 2.3 vol points. You can see that M1p/l (purple line) and therefore the combined p/l (green line) spiked at the end creating a sizeable total win.
If we look at the stock price path we’ll know why:
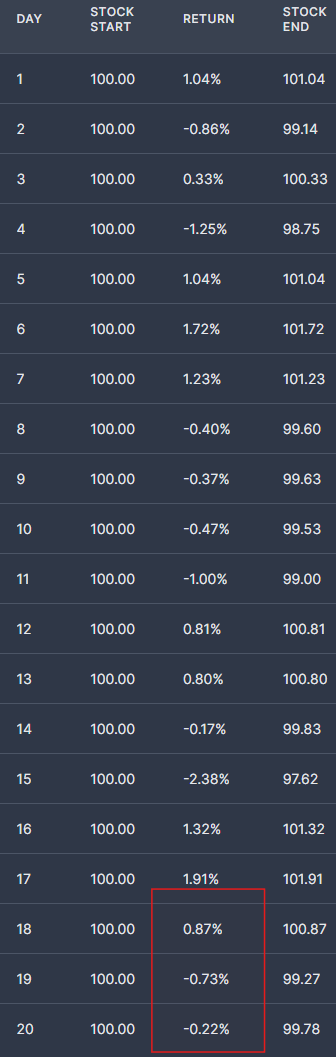
The return on the last 3 days, especially the last day, when gamma AND theta are maximized were smaller than implied daily moves of 18.4%/ 16 or 1.15%
Again, this highlights the insane noise of realized vol p/l at expiry. If you were long those front-month options, you were doing pretty well until the last 3 days, and 2 vol points worse than what the plain 1/2 vol point VRP would have predicted based on the stock realizing a healthy 17.9% vol for the full period. The short got bailed out.
You can imagine the opposite scenario as well, where the short was doing well all month, only to get crushed on the last day. That’s the beauty of the sim…you can just go look at any of the thousands of losing trials to find paths that unfolded so painfully.
Wrapping up
The tradeoff between choosing M1 or week 1 vs a longer dated option is a conundrum whether you are looking to buy or sell a single option and need to choose a maturity or if your strategy rests on discerning between months.
Wait.
I’m sorry but this aside really belongs here so bear with me:
Near-dated option p/ls are driven by the gamma/theta tug of war, long-dated options are driven by IV and therefore vega.
This is also why near-dated you think in straddles and long-dated in vol. It’s a habit that comes out of intution for what factors drive the p/l. It’s also a built-in defense against “option illusions”:
- Every long dated straddle looks optically expensive, because they grow in price monotonically by something that looks like √dte meanwhile you are comparing that growing number to the same spot price visually. But we price the straddles by the sum of all the delta-hedging we can do over the course of its life so its value really depends on like all these little scalps. The most coherent way to bascially amortize the scalps into something of meaning is an IV because we know to compare that to measures of realized for context.
- On the near-dated option side we know that IV is hyper-sensitive to the DTE we use in our model. And DTE is not an agreed upon number. Trading day to expiry? Calendar days to expiry? If it’s 10am in NY, how much of the day do you think has elapsed? How about at 3pm? These questions don’t have straightforward answers so with little time to expiry the notion of IV really falls apart. But you know what doesn’t? Straddle prices. “Bruh, what’s your market on how much the stock can move in the next 4 hours?” We can actually think about that much more easily than the minute to minute gyrations or in terms of “vol”.
I think most option traders understand these 2 distinctions in their bones.
Ok, back to the concluding remarks.
We’ll finish with a few real-world considerations and thoughts:
- We totally ignored trading costs. Trading costs, both direct and in the form of slippage, are a tax on any delta-hedger whether you are long or short options. In other words, regardless of which way you sim the strategy, there’s no bias in excluding costs — all the results will be worse.
- Correlation of IV to RV…if realized vol increases both M1 and M2 can respond. If it declines, you might make more on your short M1 but you are losing more on M2 as well. If the IV selloff happens closer to M1 expiry it will likely hurt more as you will be longer vega.
- Dollar gamma is so high near expiry that the move on the last day can have a disproportionate impact on the entire strategy’s p/l. This observation should also tell you quite a bit about how much 0dte trading is akin to gambling. As a market maker, going into expiration day with a lot of risk always felt unproductive because that day’s results would swamp all wood we chopped all month. And yet people sign up for this every day? I’d think this requires a highly devoted strategy and focus and is a narrow subset of the general business I’d describe as “vol trading” (although one that can absorb lots of intraday capital).
- A professional vol trader’s surface will, to varying extents, be cleaned for events. That process means that term structures that look descending might actually be ascending and vice versa. Rigorously filling in an event calendar to clean vols is no easy task and is a joint effort between a trading firms’ fundamental research and QR groups, but I suspect its ROI is well worth it for the scaled prop firms and HFs. 15-20 years ago a basic understanding of this was extremely profitable and probably the single most important area of analytical focus in my own trading.
Let’s leave it there.