“Renting A Straddle”
When event pricing hides extremely cheap trading day volatility
This week, moontower.ai announced several free option calculators with more to follow.
💡These are embeddable so you can add them to your own websites, Notion workspaces, or wherever you organize your insanity.
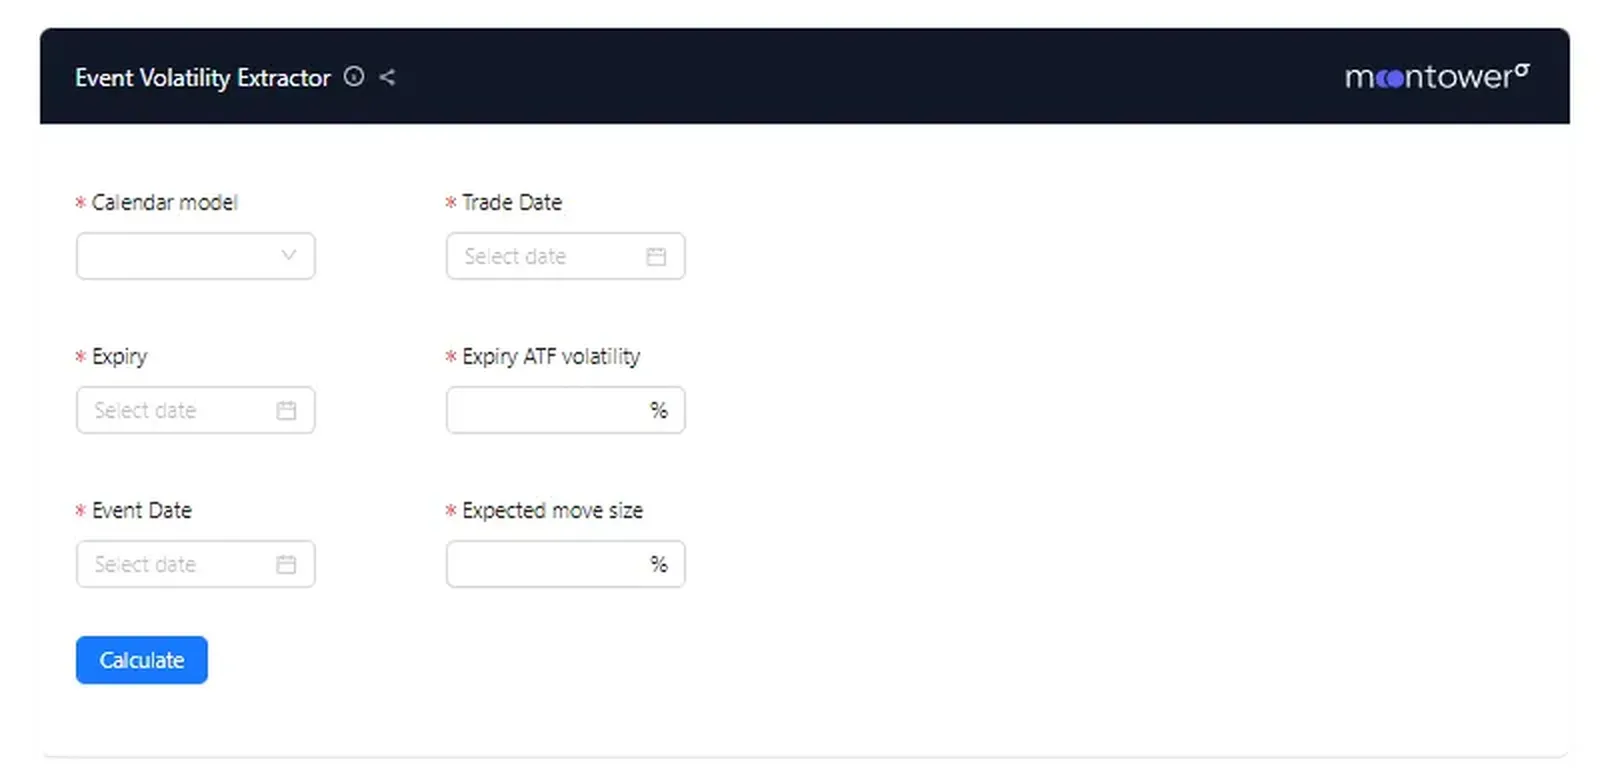
One calculator that many of you might find useful is the Event Volatility Extractor.

If a known event such as as a stock’s earnings date announcement we expect the market to assign extra volatility to any expirations which include that event.
Option traders will decompose such an implied volatility into:
- A single day event vol or expected move size
- The typical vol or move size for a regular day
If you were looking at a student’s grade in chemistry you know it was the average of the tests. But if the final exam has a bulk of the weight and the remaining tests were equally weighted you have no way of backing out with the final’s weight was.
The option’s trader faces a similar problem. How much of the implied volatility is coming from the market’s estimate of the event move size?
The best a trader can do is tinker with assumptions for the earnings or event move and then see what that implies for a typical trading day.
An “expected move size” corresponds to the value of a straddle. By converting straddles into an implied volatility for that single day, we can back out the volatility that is equally assigned to the remaining trading days until expiry.
The larger estimated event move, the lower the implied vol must be for the remaining days and vice versa.
Application: “Renting” The Straddle
Imagine a 30 day option on XYZ stock. XYZ is announcing earnings the morning of the option expiry date and you expect that the earnings move will be 4%*. Therefore you expect the straddle to be worth 4% right before earnings are announced or about 80% volatility (see straddle approximation calculator)
But what if it’s worth 4% today?
- A 4% straddle with 30 days until expiry corresponds to an implied volatility of 17.5%
- We expect the straddle to be worth 4% of the stock price just before the last trading day. A 4% straddle corresponds to an 80% volatility with 1 DTE
- Therefore, the implied volatility must increase from 17.5% to 80% between now and expiration. This increase in implied volatility will exactly offset the theoretical option theta if the straddle has remained a constant 4% of the stock price over the course of the month!
- If a trader knew this, they could buy the straddle today, hedge the gamma and then sell the straddle before earnings is announced. This kind of trade is known as “renting the straddle”.
This example is idealized. The trader got to “rent a straddle” implying zero volatility for all the days preceding earnings. It was free gamma. The example is meant to illustrate the idea that implied volatility is not distributed evenly across all days and by “extracting” volatility ascribed to events you can make better comparisons cross-asset.
*Perhaps by looking at how the name has moved on prior earnings dates. Estimating move sizes is an active area of research for practitioners. You can think of the problem inversely – you can try to fit the event size to your estimate of a fair trading day volatility. It is common to use this calculator in both directions.
