
Pigs on the Wing: vol tells us nothing about extreme moves
Tails are not just scaled up version of volatility
At the close of Friday, I was looking at far OTM gold put spreads.
With GLD at $275, the April 251/249 put spread is similar to a binary bet that GLD expires below $250 at expiry or about a 10% sell-off.*
You get 39-1 odds.
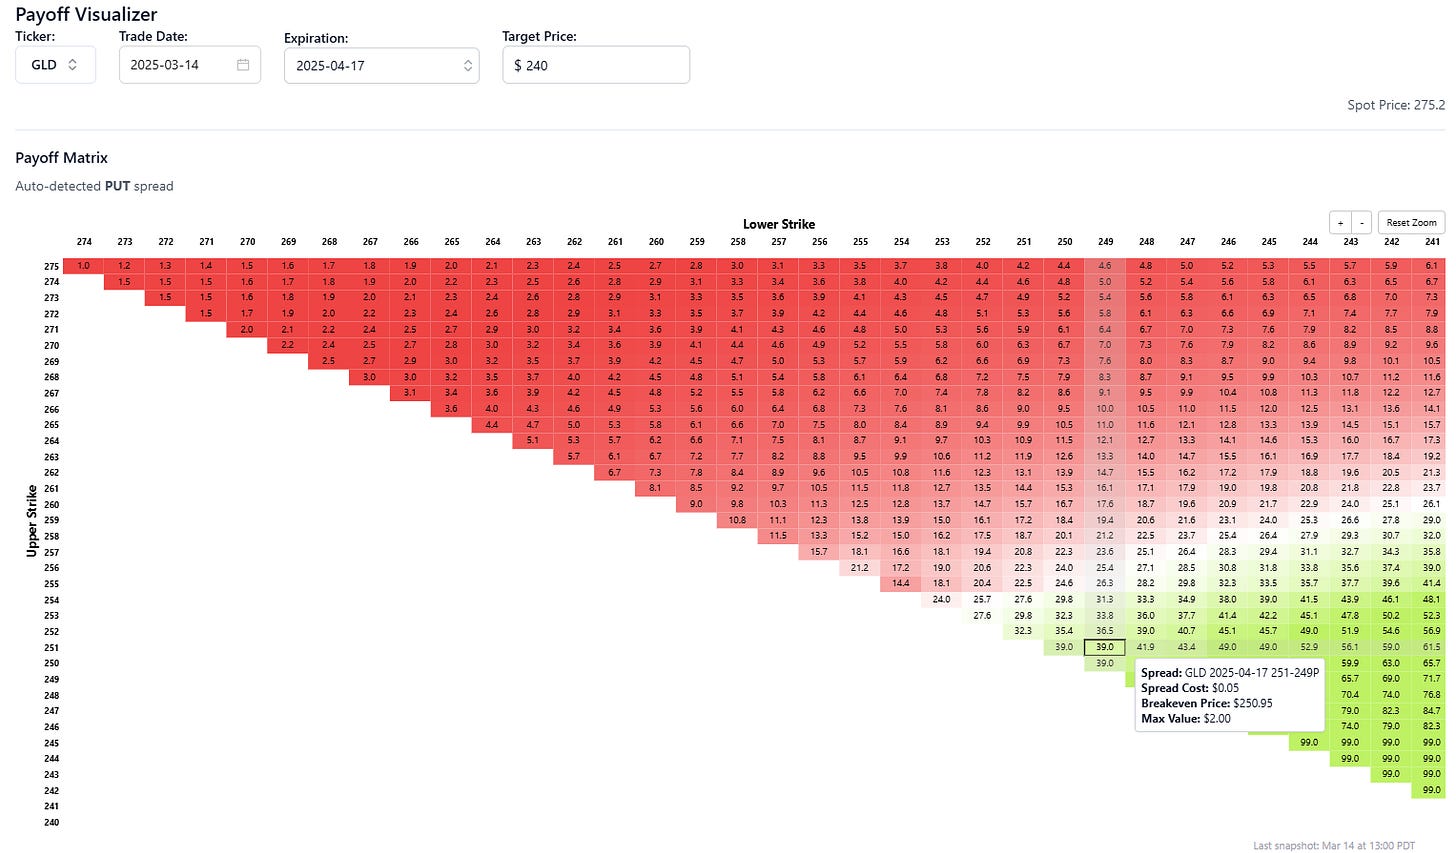
This is using market-based pricing, net of skew.
At-the-money vol is 16%.
Turns out 39-1 is about the right odds if we use 16% as a standard deviation. When I say “about right” I simply mean the gold left tail is basically conforming to an out-of-the-box Black Scholes distribution. I don’t mean B-S is “right” just that the put spread odds conform to what the B-S would say.
I wouldn’t expect that for SPX puts, but gold downside doesn’t have that much skew or tail fatness.
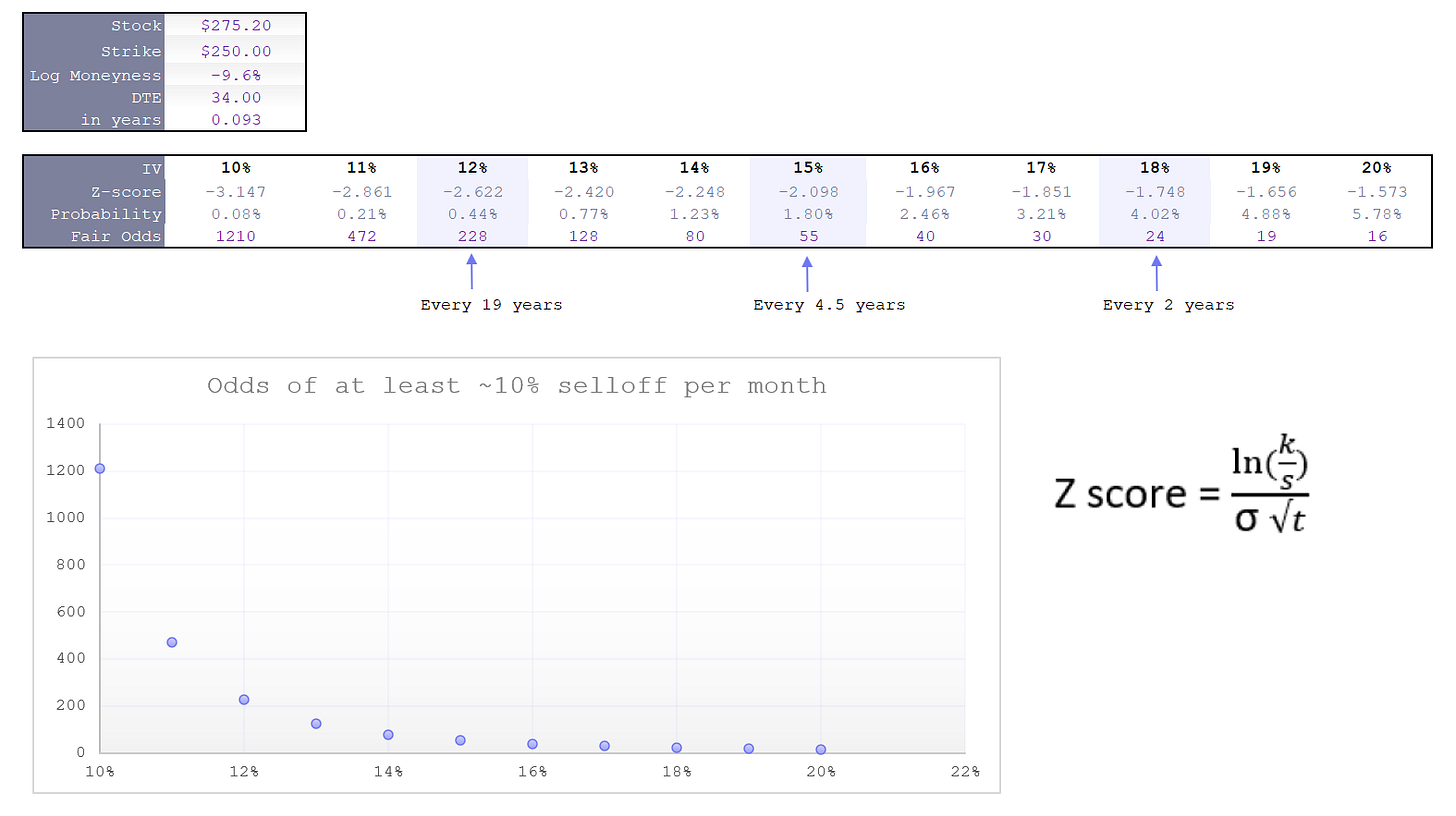
See the table mapping ATM vol relationship to the likelihood of ~10% selloff in a Black-Scholes world:
But a lesson that is far more important jumps out:
Implied volatility—the second moment of the return distribution—has almost no direct connection to the probability of catastrophic price moves!
Look how likely a 1-month 10% selloff is as a function of implied vol. If vol is 15% instead of 12% such a sell-off is 4x as likely and if it’s 18% instead of 12% it’s 10x as likely.
Just think of VIX…it can easily be 12 or 18, right? But what you should really take away from that is that volatility tells us very little about the tails.
Option Pricing on the Wing
A few things option traders learn early about pricing tails:
- At-the-money volatility tells you nothing about the true probability of large moves.
- Tail risks are not just “scaled-up” versions of small market moves.
- Historical data is almost useless for extreme events because of sample size is too small to build robust probability estimates.
Instead, traders price tails based on…other tails.
Not backtests.
I invite you to keep your eyes open for sales pitches that pretend they know the likelihood of extreme moves and how they claim to know it. And if the sample sizes weren’t small enough, marketers might try to condition the probabilities — “when the market does X the probability of an extreme event does Y” which reduces the sample sizes even more. Godspeed with analysis that looks like that.
Inferring tail behavior from the meat of a distribution is so sensitive to small changes in volatility — so sensitive that it’s a clue that they’re not strongly related. I’m not making a math argument (I’m sure many readers could say what I’m saying formally). It’s a common sense observation that falls out of the volatility itself being volatile and sensitive to sampling.
The true odds of extreme moves are unknowable but there’s no reason to think they move increase an order of magnitude when VIX goes from 12 to 18, or for that matter, get cut by an order of magnitude when VIX falls from 18 to 12.
*The concept explained in a deeper understanding of vertical spreads