Our newest feature: TRADE IDEAS
How parallel coordinates turn four volatility metrics into actionable trade structures
Every vol trader faces the same morning ritual: scanning dozens of tickers, trying to spot patterns across implied vol, realized vol, VRP, and term structure. It's like being a sound engineer with four mixing channels—you need all the dials reading right before you know you've got something worth recording.
We've built Trade Ideas to automate this pattern recognition. Think of it as your signal processor: it takes raw volatility metrics and identifies which tickers match our four core trading presets.
The Four-Channel Framework
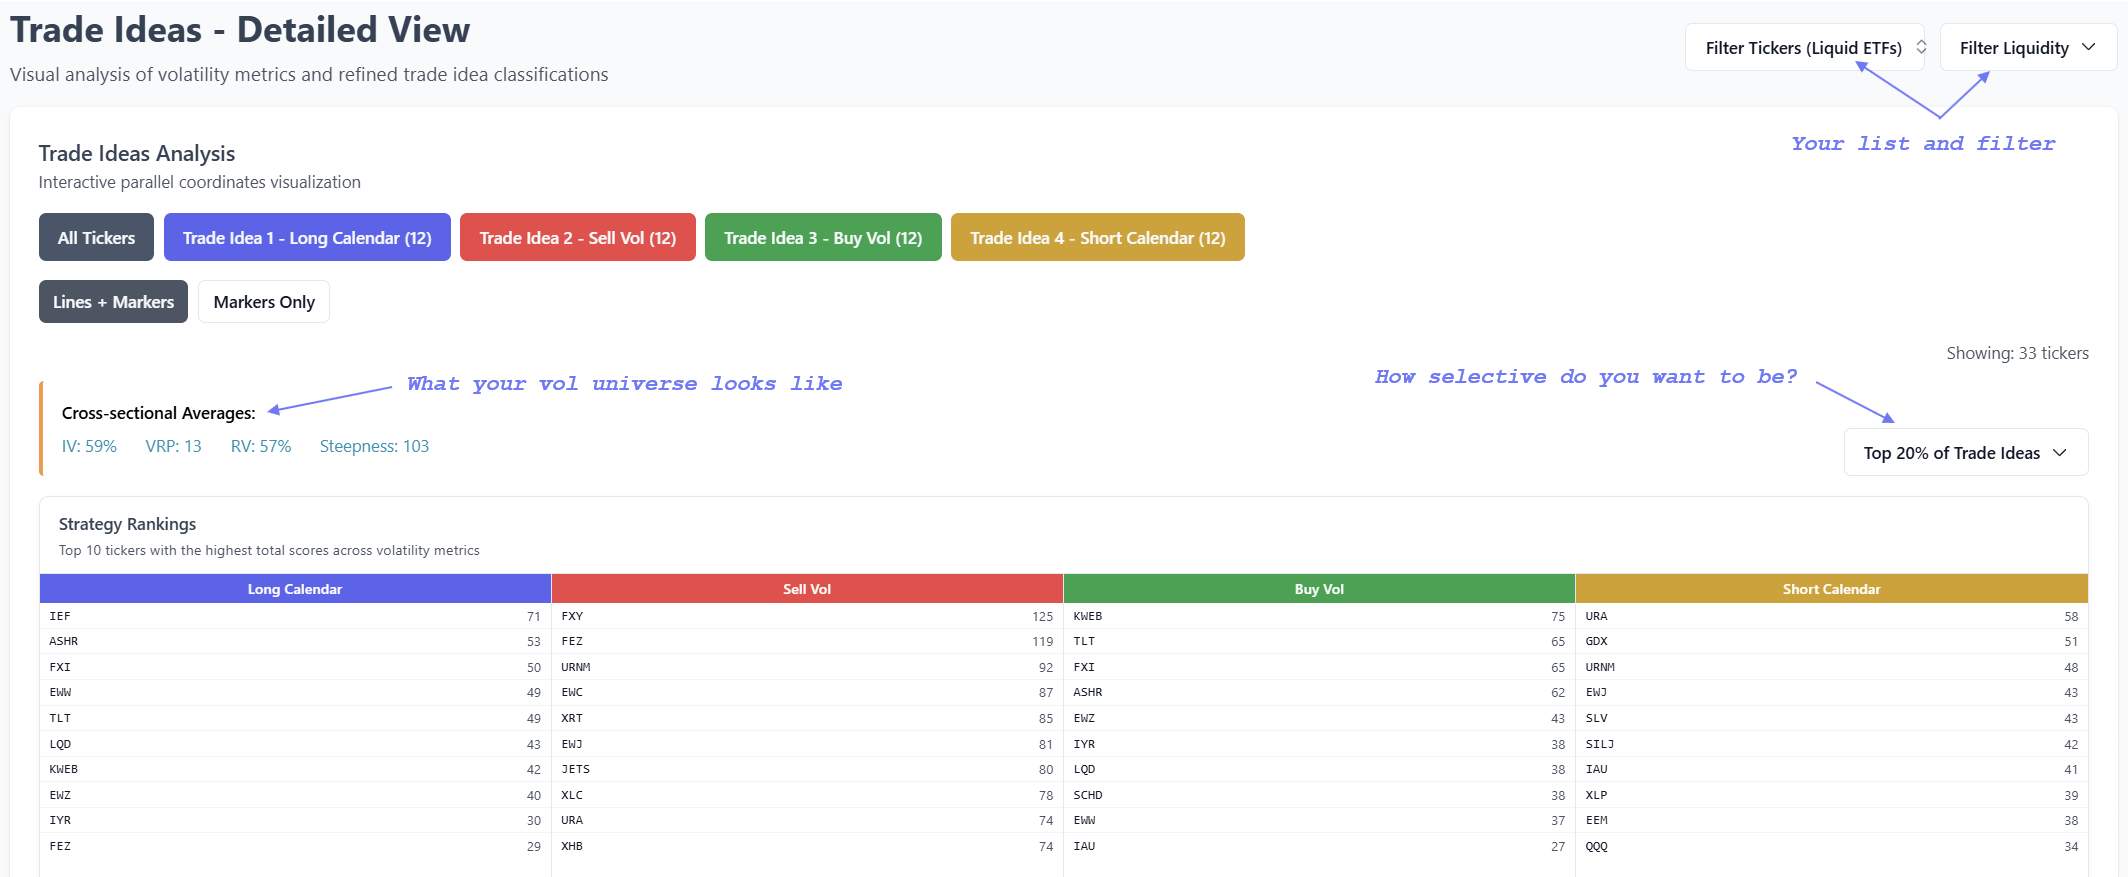
The system classifies opportunities into four fundamental volatility structures:
Preset 1 - Long Calendar: High VRP meets low IV with flat term structure. The market's pricing a premium, but near-term realized vol is suppressed. Classic setup: sell front month, buy back month.
Preset 2 - Sell Vega: High VRP atop already-elevated realized vol. The market's paying extra for protection when things are already moving. Candidates to sell options on.
Preset 3 - Buy Gamma/Vega: Everything's quiet—low VRP, low IV, low RV. Coiled spring territory where either IV can rise from the floor or RV can wake up from hibernation. Candidates for buying options.
Preset 4 - Short Calendar: Low VRP but high IV, with steep term structure. Forward vol remains rich despite recent quietness. Structure: buy front month, sell back month.
How It Works: The Parallel Coordinates Advantage
Trade Ideas uses a parallel coordinates chart to visualize four dimensions simultaneously. Here's why this matters:
Traditional charts force you to examine metrics one at a time or in pairs. You might plot IV vs RV, then separately check VRP, then look at steepness. Each view is a separate cognitive load.
A parallel coordinates chart places all four metrics side-by-side as vertical axes. Each ticker becomes a line threading through these axes. The key insight: the shape of the line tells the story.
Imagine four volume knobs in a row: IV Percentile, VRP, RV Percentile, and Steepness. A long calendar candidate traces a distinctive path—down on the left (low IV), way up in the middle (high VRP), anywhere on RV, then moderate on steepness. Your eye learns to spot this shape instantly.
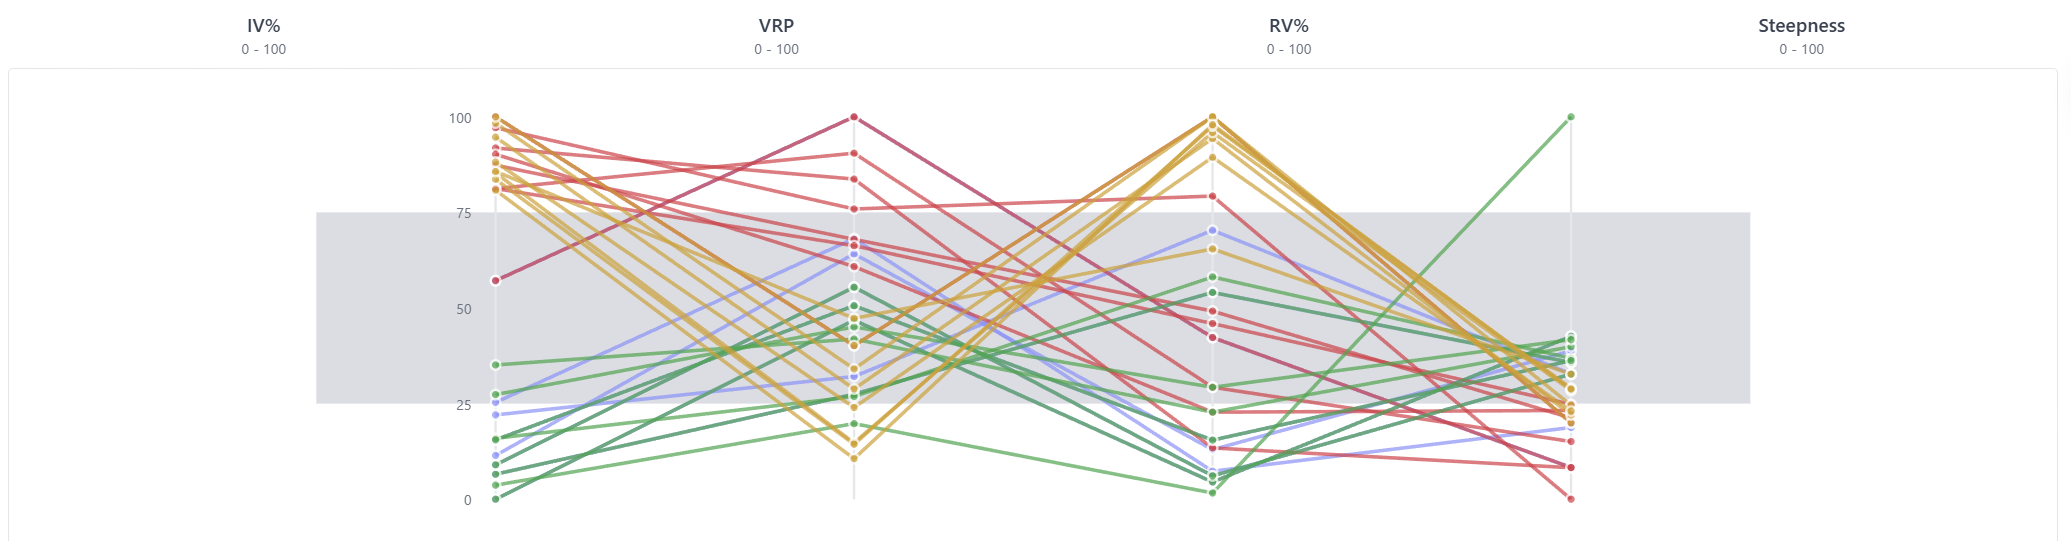
The beauty emerges when you filter by preset. Click "Preset 1" and watch the chart highlight only tickers matching that pattern. All the long calendar candidates light up with the same characteristic swooping shape. The random noise—tickers that don't fit any preset cleanly—fades to gray.
This is pattern matching at visual speed. You're not mentally calculating whether a ticker's IV percentile ranks low relative to today's universe while simultaneously checking if its VRP is cross-sectionally high. The chart does that dimensional analysis for you. Your brain does what it's evolved to do: recognize shapes.
Cross-Sectional Ranking: Your Daily Reset
Here's the critical detail: Trade Ideas rescales all four metrics from 1 to 100 based on your universe each day.
When we say "high VRP," we don't mean high in some absolute sense. We mean high relative to everything else you're watching today. If you're tracking 50 tickers, Trade Ideas ranks them 1-50 and converts those ranks to percentiles.
This cross-sectional approach adapts to market regime. In a low-vol environment, "high VRP" might be 20 points. In a volatility spike, it might be 60. The tool doesn't care about the absolute number—it cares about relative positioning within your opportunity set.
The Distance-Weighted Algorithm
Once we've ranked your tickers 1-100 on each dimension, the matching algorithm works like this:
For each preset, we have an idealized target—where we'd like each of the four metrics to sit. For a long calendar, we want IV low and VRP high. For selling vega, we want everything elevated.
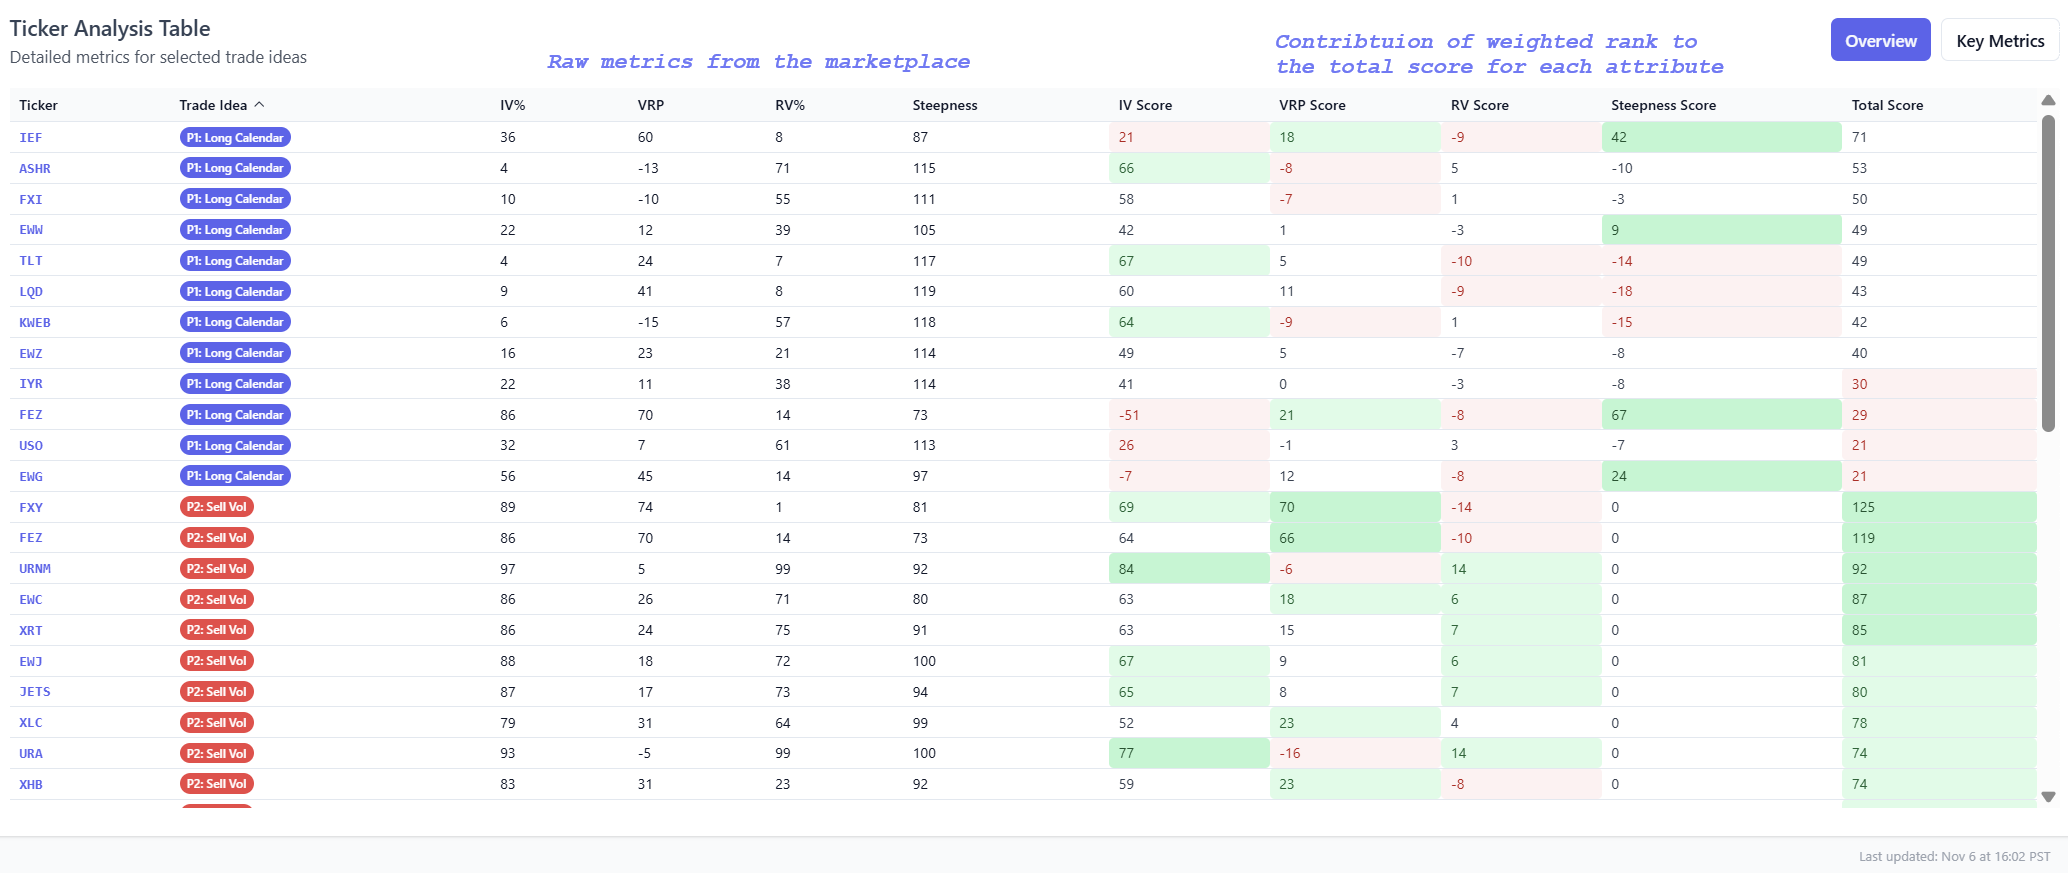
The tool calculates each ticker's distance from these ideal targets, weighting the dimensions according to whether the preset cares about that metric being high or low. Tickers closest to the ideal pattern get flagged and receive the highest scores within the preset. The trader can not only filter the top 10-30% of scores but see each metric's contribution to the total score.
Start Your Morning Scan
Instead of manually comparing IV percentiles against VRP cross-sectionally against realized vol against term structure for every ticker in your universe, let Trade Ideas surface the 10-15 names where multiple dimensions align into recognizable patterns.
The parallel coordinates chart makes these multi-dimensional relationships visible at a glance. It's not a black box generating trade signals. It's a pattern recognition tool that handles the dimensional analysis heavy lifting, freeing you to focus on the part that actually matters: understanding why a ticker fits a preset and whether the setup makes sense in current market context.
Your morning scan just got a lot more efficient.
Trade Ideas is available now in the Pro section. Import your custom ticker list and watch the parallel coordinates light up with today's opportunities.