
oil options and the raw gamma paradox
gamma and calendar spreads
The single biggest adjustment to get my head around when I crossed the chasm from equity options trading to commodity futures options was the idea that every option expiry was actually its own underlying.
In equities, a 3-month option on TSLA and a 1-month option on TSLA refer to the same underlying. The 3-month vol encompasses the 1-month vol. A 3-month option with the same strike as a 1-month option cannot trade cheaper than the 1-month option. Said otherwise, the calendar cannot trade below zero (well, with American-style options anyway).
This is not true in commodity options. A 3-month 75 call on WTI can technically trade below a 1-month 75 call on WTI even if they are the same IV simply because the 1-month future could be $15 higher than the 3-month future and therefore have $15 more intrinsic value. That example feels like cheating though.
Consider a more interesting case. I’m writing on the evening of 3/10/26:
The Nov16’ 2027 expiry 66 call, which is close to ATM, is about $6.25 at ~17.5% IV
The Nov17’ 2026 70 call, also close to ATM, is about $9.25 at ~ 42% vol
The shorter-dated call, which has less than half the DTE of the longer-dated call, is 50% more expensive! The futures price is 70/66 or 6% higher so it’s not the futures price driving the bulk of the difference.
It’s the extreme vol differential. If this was an equity, the implied forward volatility would be negative! Another way of saying this would be arbitrage.
Your equity option intuition is of no help here.
[A personal note here…this is also my favorite stuff. Equity options with their corporate actions and dividend headaches. Meh. Give me futures spreads and options on commodities all day. I loved building infra for this and trading these things. Those markets are very smart at pricing options but it also teaches you a lot about vol and risk.]
Measuring the forward vol in commodity options is a tricky problem. It was a pretty hefty component of how I’d trade commodity vol. I’m not giving away how I’d do it although I’ve hinted in prior futures-related posts at things that could get one started. This post will even fall under that category, but I’ll leave it at that.
Still, without getting into forward vols, there is a lot to understand about the risk of an option time spread in commodities. WTI, here and now, is putting on a clinic for I’m sure countless clueless option punters. And when it eventually dies down, many time spreaders are going to find themselves unpleasantly surprised as the surface finds a way to reveal that the obvious trade was but a trap.
Here’s a snapshot of 1M and 12M constant maturity IVs from CME QuikStrike. On March 9th, the ATM vol spread was 80 points wide. Prefer ratios? Fine, M1 was 3.5x the IV of M12
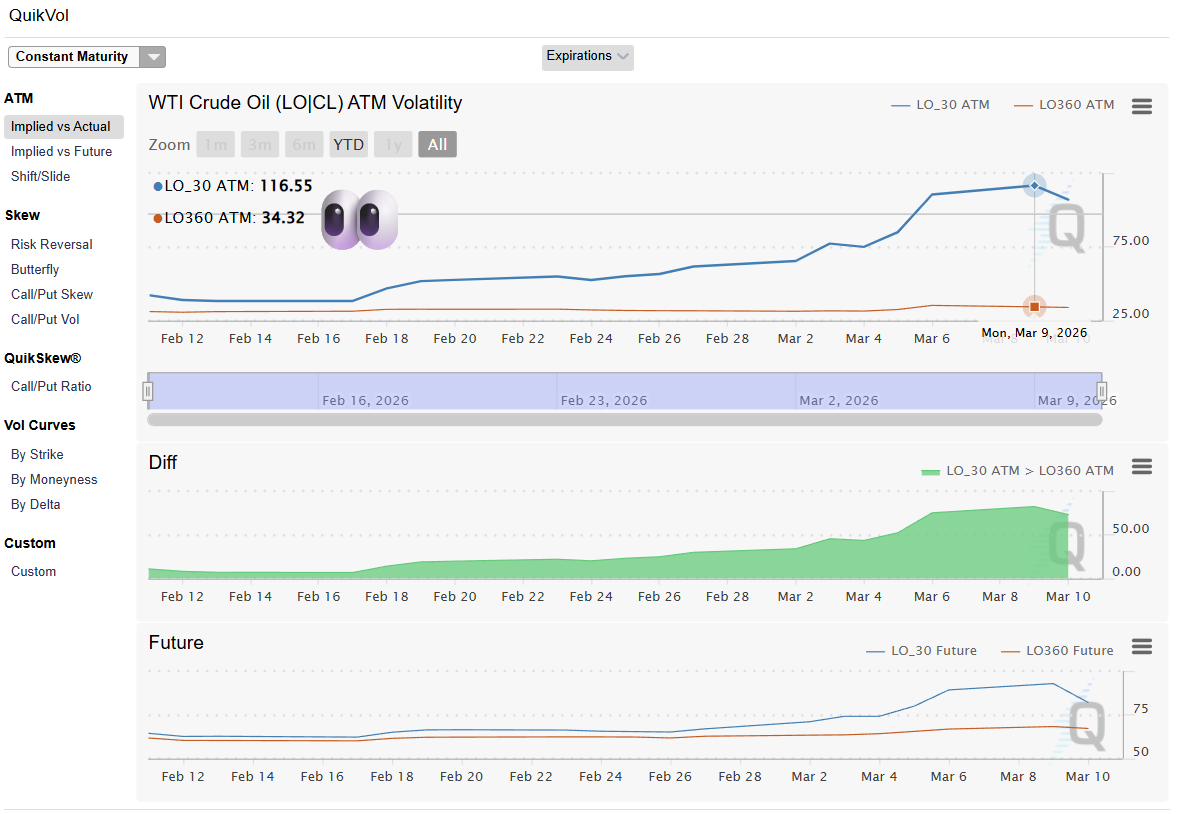
I’m going to look at realized vol data for the past year, data that is more conservative than this insane snapshot, to show how crazy you would be to think that this time spread is any way tradeable in a relative value sense.
What to expect today:
- How gamma works differently when your two legs settle into different futures contracts.
- h²: a single number that tells you how much gamma work your back-month leg is actually doing in front-month terms.
- I walk through what I’ll call the raw gamma paradox: M12 actually has more gamma per contract than M1. Except it’s a mirage.
- Why the fix of just buy more M12 vol detonates your vega and what this means for trading time spreads.
Data study setup
The analysis in this post is based on WTI M1 and M12 futures from
March 2025 to March 2026. The details and code can be found in the appendix.
The key features is we construct our own continuous contract for M1 and M12 and we estimate the gamma corresponding to constant maturity 1-month and 1-year ATM calls
Address the temptation head-on
You’re looking at crude oil options. We’ll take the vols down a notch, but if you receive my points with this more benign treatment, then it will make the current oil landscape hit that much harder.
Say M1 implied vol is sitting north of 60%. M12 is under 20%. You come from equity vol land, every instinct screams buy the back, sell the front. Look, this section is behind the paywall so there shouldn’t be any kids around:
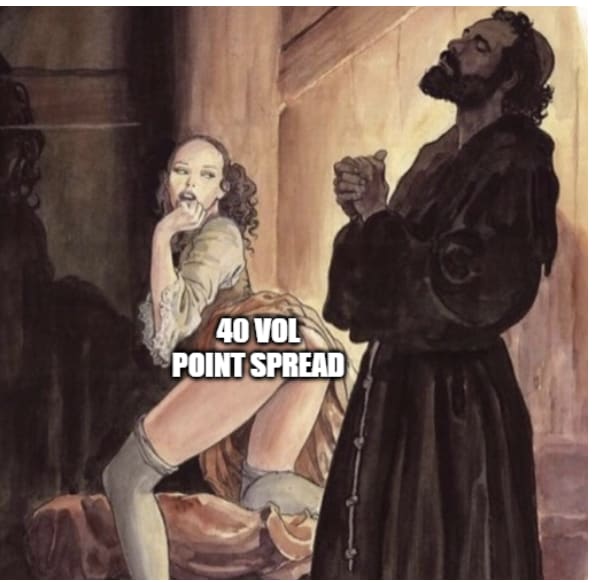
Well, minister, don’t sully the cloak for a dream. The only prophesy your filling is the inevitable penance when M1 vol rips higher and M12 just sits there. Two things are working against you simultaneously. One of them shows up in your vega P&L.
The other one hides in a measure I refer to as h².
You need this measure to weight your option model’s gamma. To derive it, we’ll combine several concepts I’ve written extensively about.
Gamma revisited
A quick review is in order.
Gamma is curvature. Your P&L on a delta-hedged option over a single move is:
P/L = ½ · Γ · (ΔS)²
The ATM gamma formula for a Black-Scholes option:
Γ ≈ .4 / (S · σ · √T)
The three things that shrink gamma are in the denominator:
Higher S (price): The same $1 move is a smaller percentage move on a more expensive underlying.
Higher σ (vol): The option is already “priced for action.” The curvature of the price function gets spread over a wider range of expected outcomes. More vol → flatter curvature near the money → less gamma.
Higher T (time): Same logic as vol. More time spreads the curvature out. The more time to expiry the less a given move influences the delta of the option. The delta of 10-year option is not going to change much based on how the underlying changes day-to-day.
A couple of educational points:
- Take note of the scaling. Double the vol, gamma roughly halves. You need to quadruple DTE to get the same effect.
- As always, a good habit when trying to understand greek levers, is to take examples to extremes. If you raise DTE or vol to infinity, all options go to their maximum value. For calls, that’s the spot price itself. For puts, it’s their strike price. That means calls go to 100% delta since they move dollar-for-dollar with the spot. Puts go to 0 delta. It doesn’t matter where the spot price goes, the option is already at its max value. It doesn’t change. If a call is 100% delta and a put is 0% delta, the option has no gamma. Its delta doesn’t change with respect to the spot.
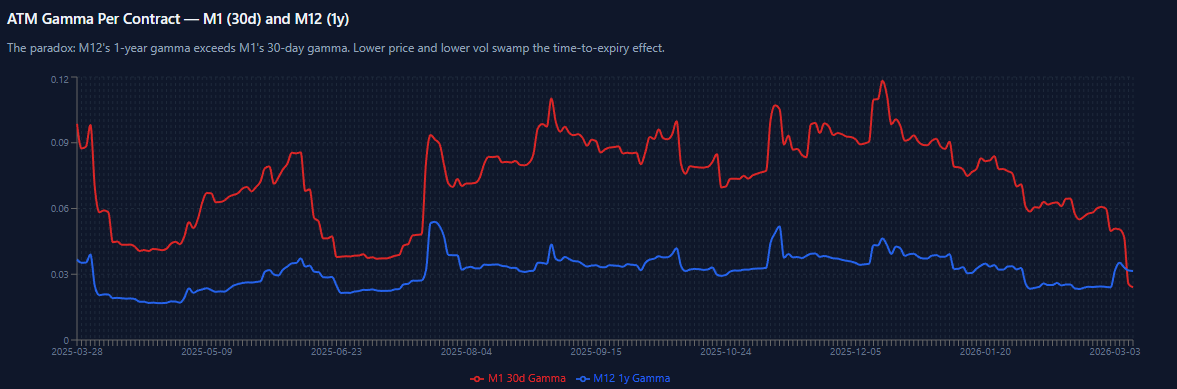
Back to our setup, you’d expect the long-dated M12 option to have less gamma than the short-dated M1 option since there is more time in the denominator. But in WTI right now, M12’s 1-year ATM gamma is actually higher than M1’s 30-day ATM gamma. Per contract, the back month has more curvature.
It will come back to that denominator in 2 ways:
- The 12-month price is lower
- Remember the scaling, DTE effect on gamma is less than vol’s effect
But we can account for all of this by updating hedge ratios.
We are going to review then expand on what exactly a hedge ratio is.
Hedge Ratio Squared: Mapping M12 Gamma Into M1 Move Space
To compare gamma across two different underlyings, you need a translation layer. You need to know: when M1 moves $1, how much does M12 move? In practical terms, if you’re long 1 M1 contract and want to be gamma-neutral with M12, how many M12 contracts do you need on the other side?
We start by recalling that beta (𝛽) is a vol ratio times correlation. A correlation of .70 means:
“If A moves 1 standard deviation, B moves .7 of its own standard deviation”
The vol ratio effectively normalizes the standard deviations of each asset. If the vol ratio is 1, then if A moves 1% then B moves .70%.
Review: From CAPM to Hedging
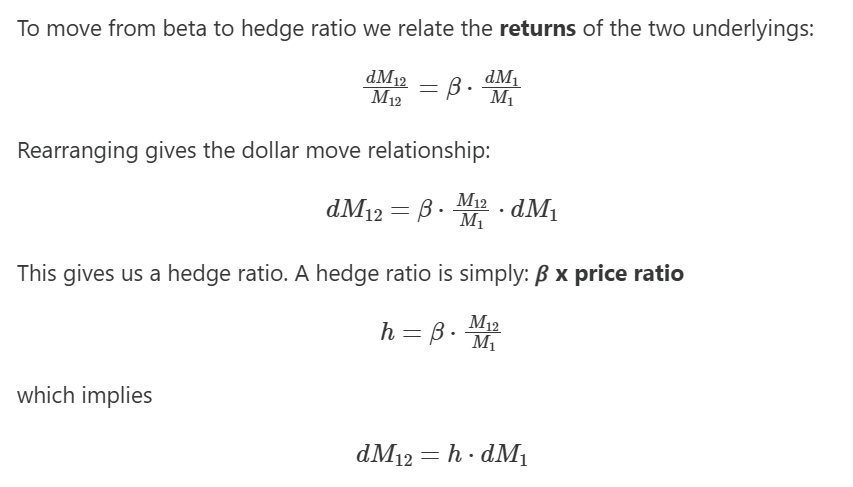
This allows us to express M12 exposures entirely in terms of M1 price moves.
This chart pulls all of this together.
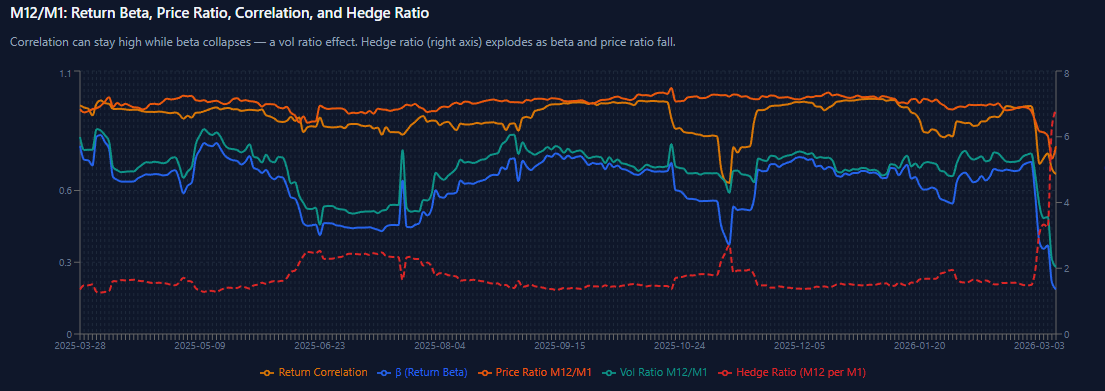
- We see that the # of M12 contracts (1/h) you need to hedge M1 is exploding as the beta collapses.
- Beta is collapsing mostly due to the vol ratio plummeting as opposed to the dip in price ratio and correlation.
h is the hedge ratio for delta.
Before we derive hedge ratio for gamma, we need a quick review of gamma p/l.
Gamma P/L
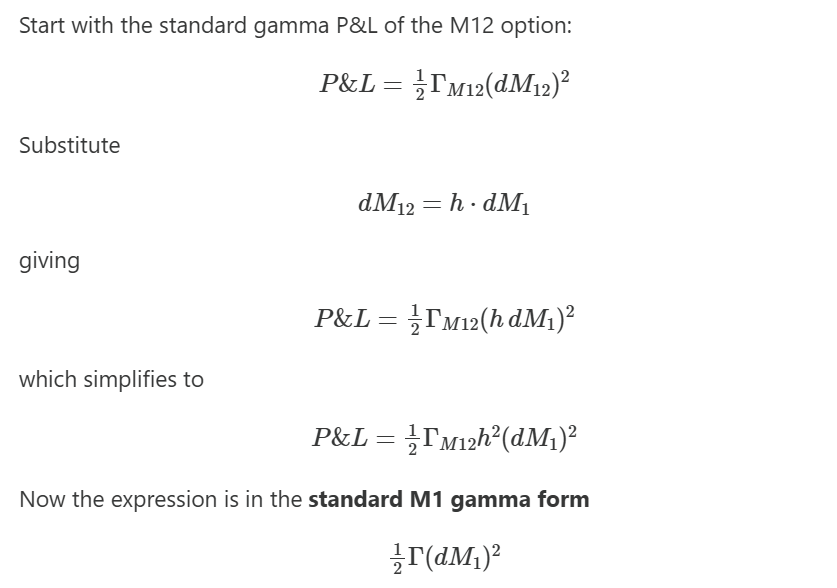
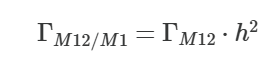
M1-Equivalent Gamma
The M1-equivalent gamma of the M12 option is therefore:
Notice how:
- Delta scales with h
- Gamma scales with h²
Based on our data, and letting realized vols also stand-in for implied vols, we get this table:
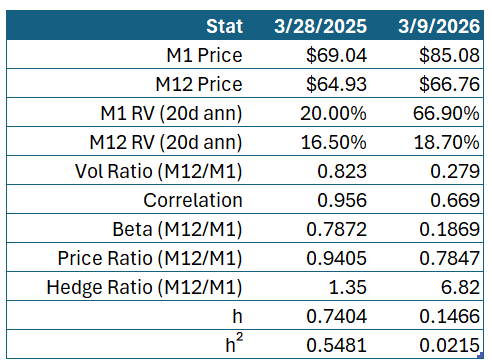
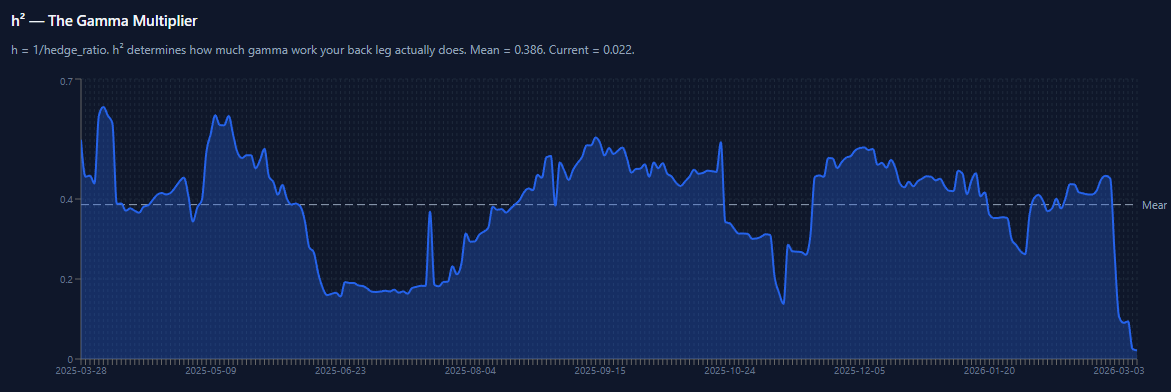
h² has collapsed to its all-time low in this dataset. The 1-year mean is 38.6%. We’re at 2.15%:
We have a very practical question we need to answer with all this arithmetic:
What does this mean for the risk of a time spread?
The Raw Gamma Paradox
The adjustment of “hedge ratio squared” is so powerful it can flip a sign.
Look at the raw gamma numbers:
M1 30-day ATM gamma: 0.0241 per $1 move
M12 1-year ATM gamma: 0.0315 per $1 move.
M12 has 1.3x more gamma per contract than M1. And this is comparing a 1-year M12 option to a 30-day M1 option.
The longer-dated option has more curvature.
How?
Remember the formula: Γ ≈ .4 / (S · σ · √T)
M12 has a lower price ($67 vs $85) and much lower vol (18.7% vs 66.9%). Both of those boost gamma. The price and vol effects are swamping the time-to-expiry effect. M1’s 30-day option should have screaming gamma from the short DTE, but the vol is so high it crushes the curvature. Meanwhile, M12 is a lower-priced, lower-vol contract where the gamma can concentrate even at the 1-year tenor.
You might look at that and think: great, I’m long the gamma-rich leg…until, of course, we impose the h² adjustment.
The hedge ratio (h) is only .0215.
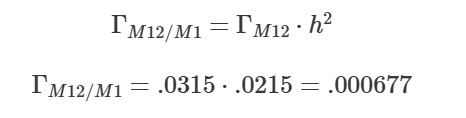
M12 1y gamma in M1-equivalent terms = 0.0315 × 0.0215 = 0.000677.
Instead of the back month having 30% more raw gamma per contract (ie .0315 vs .0241) it has 97% less (.00067 vs .0315).
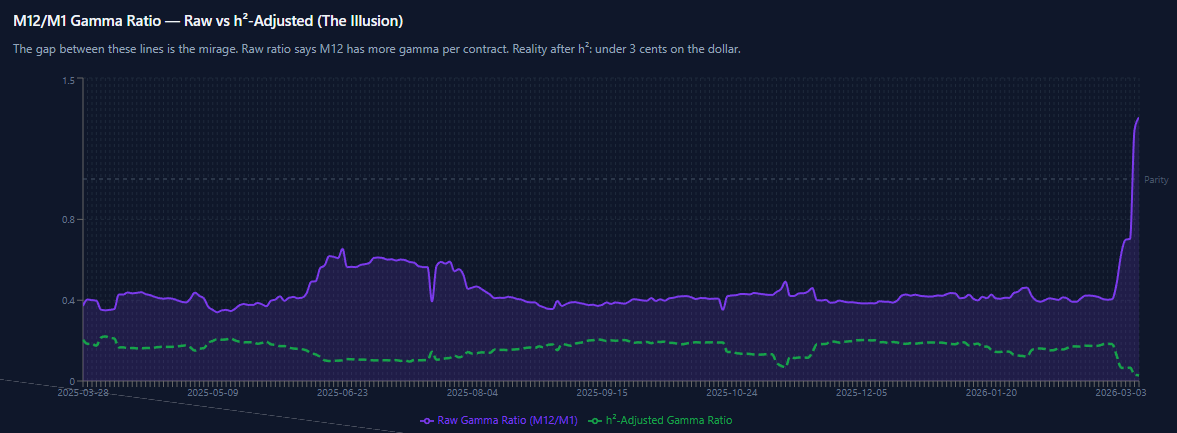
You need .0315/.00067 or about 46x more M12 contracts than M1 contracts to be “gamma-neutral”. In other words, you need “the square of the hedge ratio” quantity of contracts to be gamma neutral.
💡In the context of turning the hedge ratio into contract, quantity we use the inverse (ie recpriocal) of the hedge ratio. The hedge ratio (h) is telling us that M12 is only offsetting ~2% of the risk of M1 so we need 1/2% or ~50 contracts to hedge
Typically, h is about 1.4, requiring only a 2:1 option hedge ratio (1.4² = 2)
What does this do to your vega?
The vega of a 12-month ATM option is √12 or ~3.5 greater than the vega of a 1-month ATM option. If you are long a 1-year option time spread you are long vega. But if we assume that vol changes themselves are proportional to √T then you could argue that your scaled or normalized vega is flat.
If you want to be gamma-neutral, you’d typically need about 2x as many 12-month options because of the typical h². You can’t solve for being gamma-neutral without being long vega. But now the conceit becomes especially ridiculous when h² collapses to .0215. You’d need to be long an outrageous amount of vega to be gamma-neutral.
The position being completely uncomfortable tells you something. These options have nothing to do with each other. The two risks are knotted together by h², and when h² is at 0.0215, they’re not touching. You might as well be spreading options on 2 different assets.
It’s the same problem with pair trading vols. In a normal circumstance, 2 assets might have a reasonably strong correlation. But once one leg has an idiosyncratic episode, it turns into the equivalent of M1 in our analogy. You can mitigate some of this by not pair trading vols on individual equities, as inter-equity correlations will be more volatile than inter-sector or inter-index.
[For folks on exotic vol desks, you will remember some pretty insane dispersions in international index vols circa 2018 coming out of the worldwide vol depression of 2017].
Spread Gamma
Mechanically, your unadjusted option model might show your long time spread is long gamma. But as oil rallies and your front month delta gets short relative to your back months, you are, in the parlance of commodity trading, “short spreads”. You are short M1 and long M12 due to gammas as M1 goes up much faster than M12. So your headline greeks might say you are “long gamma” but a commodity trader would immediately recognize that this position is short “spread gamma”. It’s not exactly the same as being short calendar spread options (topic for another day) but it’s similar so long as the spreads have a positive beta to the M1 future. In other words, if M1 always moves more in dollar terms than the months behind it, whether it’s to the upside or downside.
Real-life risk
One of the great features in the ICE Option Analytics software (formerly Whentech) was the multiplier column in the futures configuration. It allowed you to enter a hedge ratio for each term. So, for example, if you thought that M12’s hedge ratio was .50 then your software would say that long 100 M1 and short 200 M2 was a flat delta in the summary risk. You would, of course, still pay attention to the spreads you had underneath.
On any given day, the futures spreads might underperform or outperform the hedge ratio parameter, introducing noise into the p/l you expected for a given futures move. But critically, the software also adjusted your gammas in each term by the square of the hedge ratio.
[You can thank me for this. When the product was still in beta days (no pun) around 2005, I was the one who spotted that gammas were only being adjusted for the hedge ratio, not its square. You notice these things when your p/l doesn’t seem to line up with your expectations based on your greeks.]
Manually updating the h’s in your model is a hands-on way to feel just how volatile they can be. I would keep a separate spreadsheet with realized vols and correlations and revise the hedge ratios once a week or so.
[For seasonal commodities, h is not just a noisy function of DTE, but depends critically on what month you are in. A “3-month” option in WTI is always kinda the same thing, but a 3-month option on corn in Sep is very different from a 3-month option on corn in May. That spreadsheet had more hair on it for the seasonal names.]
Wrapping up
Today you learned how to properly weight your model gammas. If you plan to trade option portfolios in a professional setting you will impale yourself without understanding how gammas stack.
These ideas will help you group gammas in related names to summarize risk more intelligently, but it will also alert you to when the risks that you think are related simply aren’t.
Appendix
METHODOLOGY
===========

Universe:        WTI crude oil futures, M1 (front month) and M12 (12th month)
                 Contracts roll monthly (CLK5, CLN5, CLJ6, etc.)

Period:          2025-03-28 to 2026-03-09 (237 trading days with complete data)

Returns:         Daily log returns on M1 and M12 settlement prices

Realized vol:    20-day trailing annualized based on daily close-to-close
                 Computed separately for M1 and M12

Beta:            20-day rolling return correlation * vol ratio 12m/1m

Hedge ratio(h):  M12 contracts needed to delta-hedge 1 M1 contract
                 1/(beta * 12m price / 1m price)

h²:              gamma multiplier
                 Γ_M12 in M1-equivalent terms = Γ_M12 × h²

Gamma:           Black-Scholes gamma for ATM call option on [M1,M12]
                 S = price, σ = trailing 20d RV, T = [30/365, 365/365], r = 0

Caution:         Implied vol set equal to trailing 20d realized vol
                 (i.e. options are priced at current realized, not market implied)

Code:            https://github.com/Kris-SF/data-pipelines/blob/main/wti-futures/wti_m1_m12_returns.ipynb

Data Source:     IB API