
Moontower "Blaster" Tool
"buried treasure" trading
We talk quite a bit about how options are about volatility and looking at them with only a directional lens can lead to nasty surprises. Like buying puts, getting the stock’s collapse correct but still getting rinsed because you paid too much for vol.
Unhedged vertical spreads offer much cleaner ways to use options for directional trades.
Spreads:
- involve buying one option and selling and other so you can sterilize much of the vol risk and greeks.
- have defined risk and payoff allowing you to size the trade to a max loss budget. I call these trade expressions “risk-budgeting”
- are distributional bets that are loaded on the probability of an outcome (as opposed to their opposite…a naked tail option which is less about probability and more about the distance the stock and travel and vol of vol). Spread bets can be thought of like sports bets. Binary or discrete scenarios while outright option trades are a 3D plot along 3 axis: time, implied volatility, and stock move.
I explain them in both theoretical and practical terms in:
a deeper understanding of vertical spreads (10 min read)
After reading that you can expect to automatically start translating the price of vertical spreads into implied probabilities.
[By comparing the cost of the call spread to the max payout based on the distance between the strikes we can compute the probability of the stock expiring above the midpoint of the spread.]
Today, I’ll show you the mockup of a tool we are shipping to moontower.ai in the next week or so. Calling it the Blaster for now. Subject to change.
The Blaster provides a quick answer to a practical question that takes the form of:
“What’s the best bang for my buck if I think IBIT gets to $100 by Jan 2026 expiry?”
[IBIT is the spot BTC ETF and with a current BTC/IBIT ratio of about 1740, $100 IBIT corresponds to about $174k in BTC.]
On 1/28/25 I fetched the Jan2026 options chain for IBIT (price ref = $57.97).
We look at every combination of OTM calls up to the $100 target price.
“Buried treasure” pricing
The tool aims at the simplest trade prospecting idea — what risk/reward is the option market offering me on betting on an outcome? I’m going to bury the chest in my backyard and dig it up in a year and see if all the premium rotted away inside or if it multiplied.
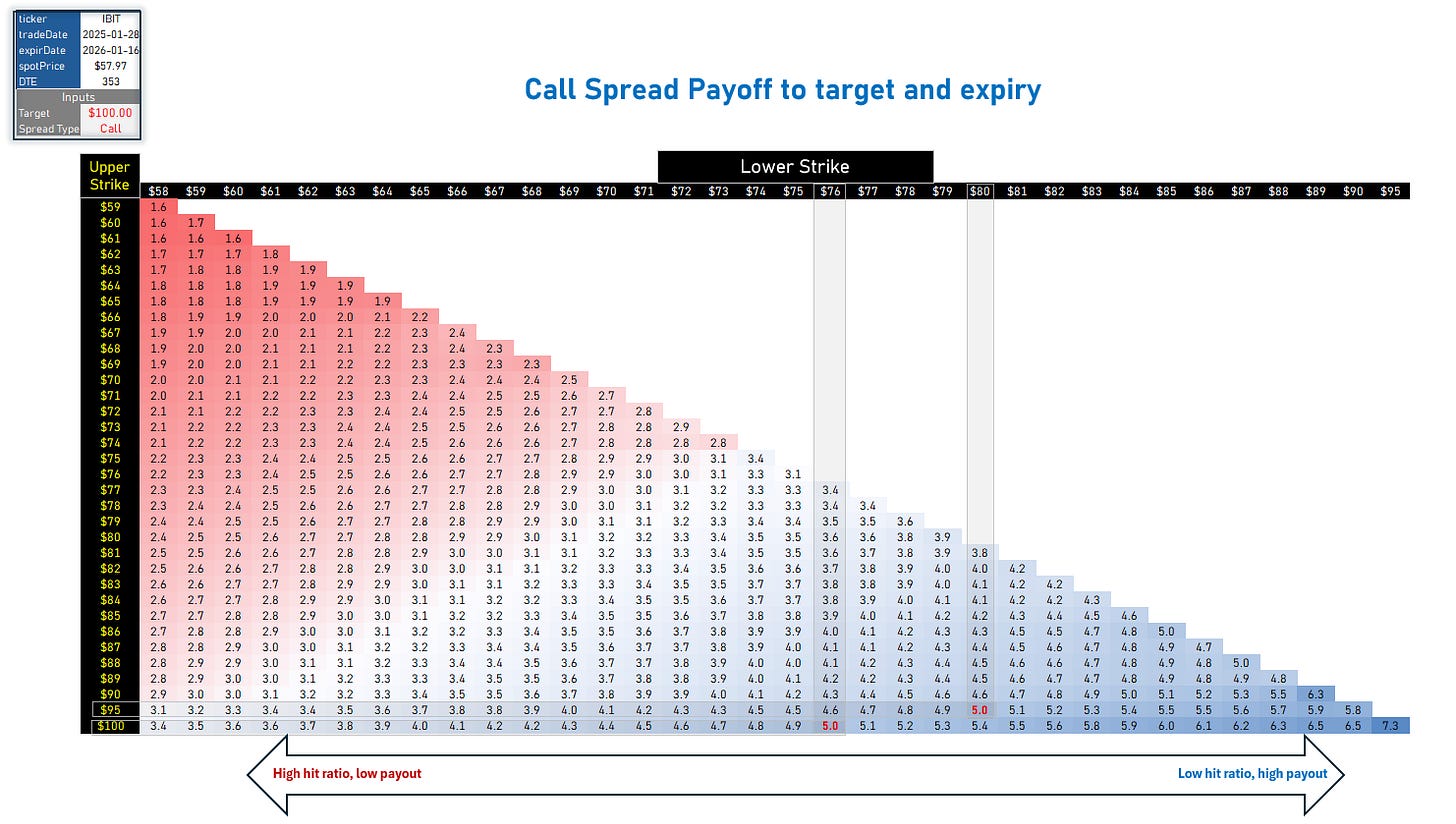
The tool quickly reveals the tradeoff between hit ratio and payoff. In the highlighted cells you can see that both the 80/95 call spread and 76/100 call spread would pay 5-1 if IBIT expires at $100.
The 76/100 call spread costs more than the 80/95 call spread but also has a higher probability of salvaging some of the premium spent. No free lunch. But the tool highlights the frontier of tradeoffs between payoff and hit ratio so you can be surgical about which spread suits your need. For any pair, you can specify the premium your willing yolo and it will tell you how many spreads to buy.
Butterflies and implied distributions
If vertical spreads imply probabilities butterflies, which are spreads of spreads, imply distributions by imputing a probability density at each strike.
Covered in multiple places:
- a deeper understanding of vertical spreads (10 min read)
- What The Widowmaker Can Teach Us About Trade Prospecting And Fool’s Gold (10 min read)
- Path, VIX, & Hit Rates vs Expectancy (14 min read)
In practice, it’s uncommon to have a beautifully smooth vol surface looking at mid-market prices. The calls on one strike could be leaned down, the next strike leaned up compounding errors when you measure spread prices from bid to offer. Snapshotting option chains and jagged data artifacts be like pb&j. That said, it’s not a major issue unless you’re a market maker who trades for ticks by ironing out kinks. Since I grabbed the spread prices I figured why not look at the butterflies and cumulative distribution based on that Jan 2026 option chain.
Because of the artifacts I’m not suggesting there is any opportunity in the below chart. However, if this was a reflection of tradeable prices down to the penny I can at least demonstrate what a kink in the surface looks like in price space (as opposed to via an IV skew).
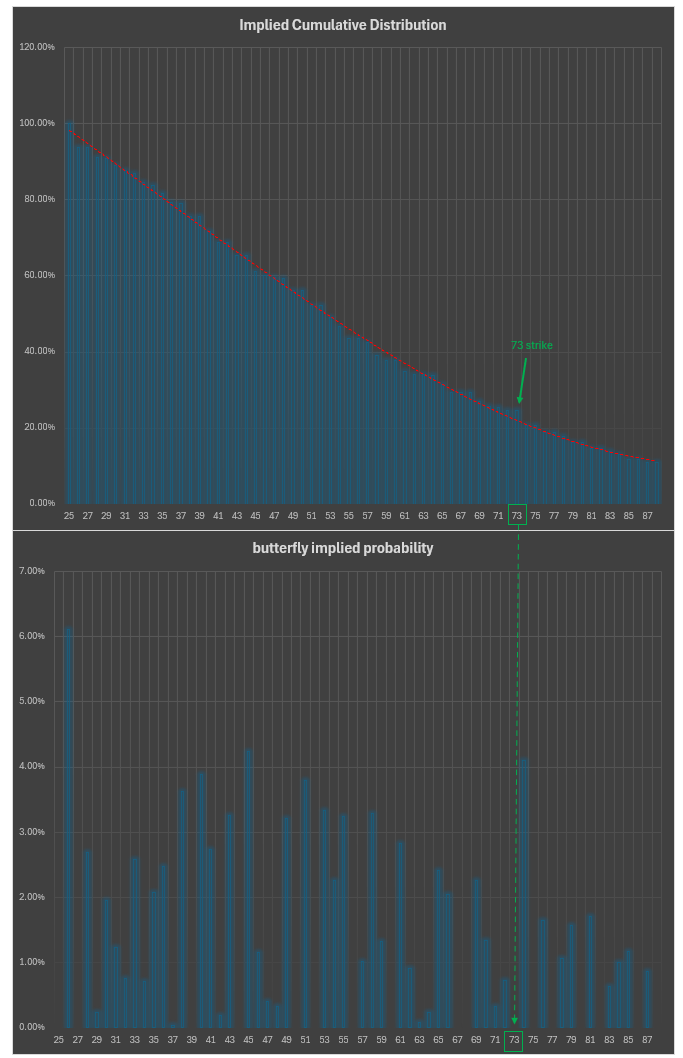
The cumulative distribution suggest that the probability of IBIT expiring above 73 is a bit higher than what a smooth curve fitted to the call spreads would suggest. It actually looks like 70 thru 73 strikes are relatively expensive compared to the 74 strike which is pulling up the implied probability of S>$73.
In the butterfly density chart, the butterfly with 74 as the meat (ie the 73-74-75 fly) is jacked. What does that mean?
The 73-74-75 call fly = 73 call + 75 call - 2 x 74 call
If the fly is “expensive” that means the 74 call must be “too low” algebraically. If the 74 call is too low then call spreads that “sell the 74 call as the higher strike leg" are relatively expensive.
All of these observations translate to the probability of the stock being above 73 strike is relatively high compared to the probability of the stock being above 74. The probability dropoff is not “smooth”. It’s discontinuous.
So if the 74 call is low, then on balance you’d prefer legging spreads that “buy the 74 strike”.
Note how the 72-73-74 call fly is worth zero on the chart. Again, fly algebra — the 73s are “too high”. The meat is expensive in this case. 2x the meat is worth the same as the wings? Makes no sense…the least a call fly can be worth is 0. Buying the 72s and 74s to sell the pumped 73s to leg the fly for zero or even a credit is an arbitrage.
Again, I’m not presenting anything truly actionable to a retail trader. This is the realm of vol surface computations and bot orders done on high performance hardware. You’re not click-trading into these things. But it might connect the dots between how relative value trading relates to flow inflecting parts of an option chain. All these little point spreads and parlays getting whacked and lifted because they’re off by a penny.
[For those of you who had the chance to play StockSlam I think you might have gotten a more visceral feeling for arbitrage trading but at a human speed].
💡How payoff is calculated in the cells
[distance between strikes]/[spread cost] - 1
Wrapping up
The tool will be available to moontower.ai subscribers under the Pro plan. The screenshot above was my Excel prototype.
[Puts on a suit and tie]
Ahem:
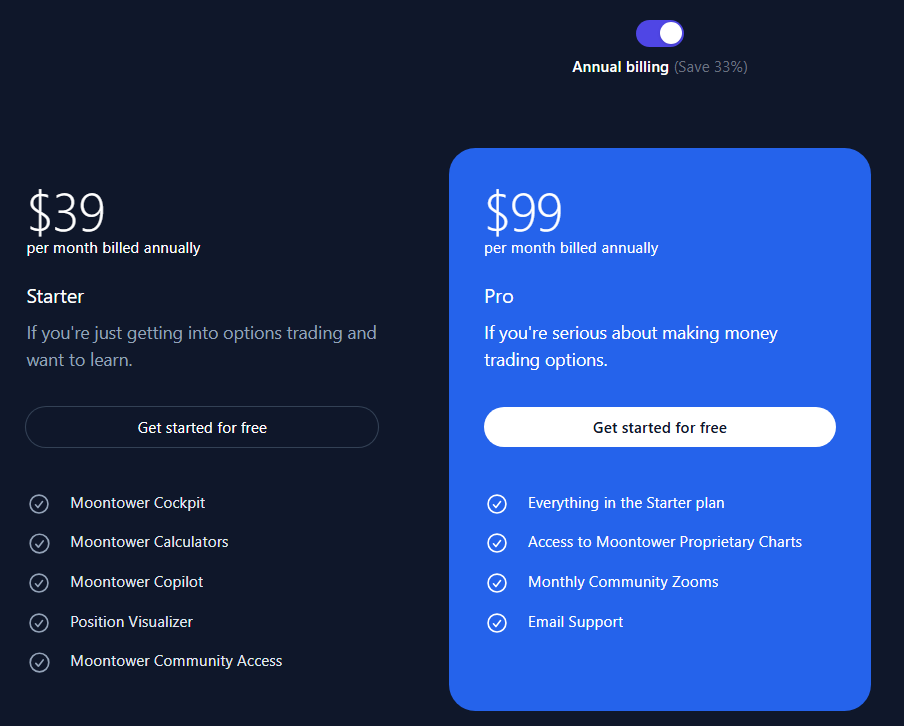
The Moontower Community is a Discord (launched on Jan 1) and as a reminder all Pro subs get free access to the Substack paid posts.