JEPI and the...Atlanta Falcons?
A follow up on derivative "income" ETFs
This is a follow-up to Derivative “Income” Bumhunting where I shared skeptical takes on derivative income ETFs from:
- quants (Roni Israelov, David Nze Ndong, the Alpha Architect)
- a former options market-maker who runs an RIA that uses options (Mark Phillips)
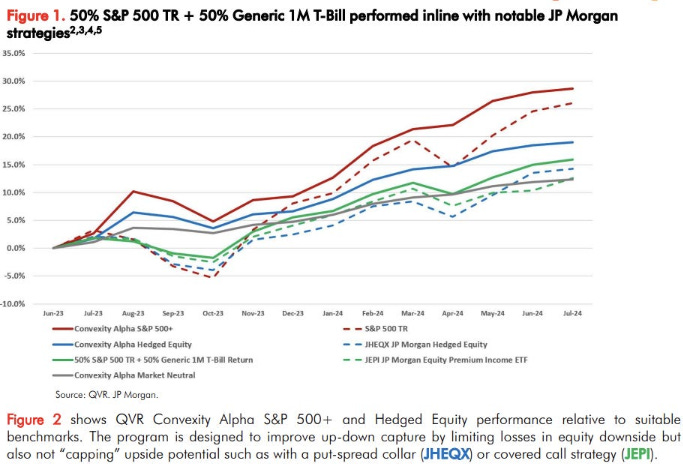
- a relative value vol manager (QVR)
- a tax specialist (Brent Sullivan)
I also gave the moontower take which was more of an eye test that rhymed with Mark’s take — an alpha approach to vol is simply not going to be rules-based. Option alpha is built on quicksand because the direction, size, and persistence of opportunity depends on the opponent (the market’s bias). When fear is dominant, you get paid for selling volatility but when the adversary is complacency the job to be done is to pay theta and warehouse options. You get paid for taking what the market gives you.
An ETF with an options mandate is a point guard than can only go right. So the onus is on the investor to know when to put that point guard in the game. It’s not a set-it-and-forget-it choice — you have to be the coach.
No asset gatherer is going to tell you that. This isn’t index investing where you get paid for time and tolerating swings.
Let me revise that.
Part of it is — you are effectively selling in-the-money puts so you are getting some exposure to equity risk premium and then some exposure to a risk premium that is sometimes consciously taking away your right hand dribble. Algebraically you are paying that point guard a lot in fees and tax treatment considering the pure equity risk premia piece can be had for zero.
You can make a valid argument that options can be used to change the shape of your payoff instead of alpha. But this works because options are surgical tools priced for specificity. The logic of passive call-selling is anything but that. Even if I granted such logic, you still need to show why you aren’t just better off buying less shares to match the delta (the ETF’s are less volatile because selling calls means they aren’t 100 delta like SPY) of the ETFs you’re considering hence saving on explicit and hidden costs for a payoff shape that does significantly better in every case except where the market sits relatively still.
[Personal bias warning — the utility preference to outperform when nothing is happening is bizarre. I want to outperform on the downside because I get the double whammy of my wealth holding up better PLUS all the things I want to buy getting cheaper. If you think of your future purchases as a liabilities, ie maybe you want to buy a condo in Miami, your assets are not only holding up but your liabilities are shrinking on the downside. Likewise — there some component of the upside distribution that is an inflationary, blow-off top. This is a disaster to underperform in — or more directly, the stupidest call option you ever sold. I’m being dramatic to mention this in the admittedly narrow context of covered call ETFs but I’m just sharing why I think shifting payoffs from large moves to small moves has never really appealed to me. And just to get ahead of the “the real distribution has more small moves than the Gaussian assumption” — yea I know. So do the vol markets which use surfaces to “correct” the bell-curve. If you want to parse the price beyond that you are now in the club of “one’s life’s work”. That speakeasy’s password changes monthly and won’t be found in the VRP article you read one time in 2011.]
So far, this is all high-level take based on why alpha can exist, how options work, and their adversarial zero-sum nature. Let’s look closer shall we. I grabbed returns for the largest derivative income ETFs to do my own up/down capture analysis. Up/down capture is the metric QVR used — it’s a solid choice. I’m familiar with it from my days at Parallax. You’ll see why it lends itself well to hedged funds.
Learn:
- how I did the analysis (including normalizations)
- why I think the up/down capture formula you find all over the internet deserves adjusting
- how to interpret the results
Draw inferences about:
- the actual performance
- what performance depends on
I’ll focus on JEPI because the findings are interesting and as you’ll see — there’s more to the story than QVR’s picture:
Onwards…
What is up/down capture?
The up/down capture ratio measures how an investment performs relative to a benchmark index during periods of market gains (up capture) and market losses (down capture).
An excerpt and example from YCharts:
An upside/downside ratio of 100 means that the investment typically performs the same as the benchmark regardless of if it is rising or falling. If the benchmark increases by 10%, the investment increases by 10%. If the benchmark decreases by 5%, the investment decreases by 5%.
Investments usually don't have upside/downside ratios of 100. Sometimes, an investment may rise 15% when their benchmark rises by 10% but falls 12% when the market falls 10%.
In this case, we calculate the upside/downside capture ratio by dividing the investment's upside return and dividing by the downside return:
(.15/.10)/(.12/.10) = 1.25
Multiplying this by 100 gives us an upside/downside capture ratio of 125 for this investment.
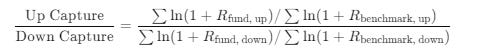
Formula
Upside/Downside Capture Ratio = (Investment's Upside / Benchmark's Upside) / (Investment's Downside / Benchmark's Downside) *100
YCharts uses monthly returns data to determine Upside/Downside Capture Ratio
QVR contends that up/down capture is indicative of manager skill…up/down capture is important not to only produce superior performance but to have any potential of outperforming relevant benchmarks. Or said differently, knowing your manager is not destroying value.
I’d simply put it as — knowing your manager is better than levered beta.
If your manager is up 15% when the market is up 10% and down 15% when the market is down 10% the ratio is:
150% up capture / 150% down capture = 1
Like any single measure, up/down capture could never be a final word. T-bills have low up capture but amazing down capture. If SPY is down 5% and T-bills return 5%, is that negative -100% down capture? The whole up/down capture measure breaks (it’s also a dumb example to benchmark T-bills to SPY).
Investopedia also uses the YCharts method.
When you google up/down capture the first 3 results are Investopedia, Morningstar (there method is ambiguous despite publishing the stat for its funds), and YCharts. In fact most results on Google’s first page use the Investopedia/YCharts method.
Eh.
We already saw one problem with that computation — when the sign of the benchmark and fund return differ the ratio is negative.
The second problem is familiar to anyone who looks at ratios frequently — dividing by small numbers. If the benchmark return .05% and the fund returns .50% you get an up ratio of 10 for the period. It sticks out like a pimple on a chart even though it’s not an especially notable data point.
There are 2 superior methods to computing up/down capture.
- Up/down spread
If you scroll down to the BTS Funds doc you learn that’s what Morningstar actually does. They simply take the difference between the fund and benchmark returns. This is also QVR’s method.
The logreturn method
This is what I use:
[Apparently some place on the google search results called Longs Peak Advisory does a geometric return method which is basically the same]
JEPI
etfdb.com describes JEPI:
The JPMorgan Equity Premium Income ETF (JEPI) is an actively managed fund that generates income by selling options on U.S. large cap stocks. The fund invests in S&P 500 stocks that exhibit low-volatility and value characteristics, and sells options on those stocks to generate additional income. JEPI was launched in May 2020.
At $35b, JEPI is the largest derivative income fund.
When we compare the performance to SPY since July 2020 (I picked July because it lined up with the lookback windows of the volatility calcs), we see that it underperforms, but doesn’t drawdown as hard as SPY in 2022 and doesn’t recover as quickly in the past 18 months.
Which is really just an indication of what we know — it’s less volatile than SPY. This is by constitution. It sells calls against a long position so JEPI is simply long less net delta. The vol ratio bounces around a range of 30-80% but the average is 61%. Said otherwise SPY is 2/3 more volatile than JEPI on average.

But we want a better look at the risk/reward of JEPI relative to SPY despite the vol difference. Sharpe ratio is a conventional choice. This is rolling 1 year Sharpe (I don’t subtract the RFR from the numerator though) computed from daily logreturns. The chart starts in summer 2021 because the lookback is 1-year.
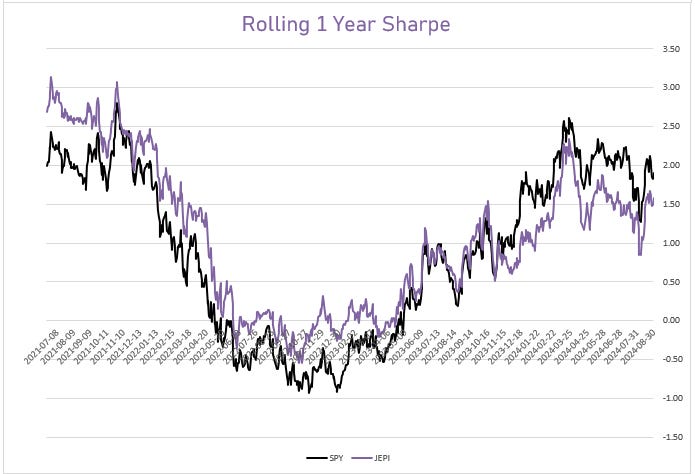
Not that JEPI performs better for the first couple years before giving up ground and finally being overtaken about 1 year ago.
Let’s look at the up/down capture. Instead of using monthly data as its commonly reported, we will use more granular weekly returns with a rolling 1-year lookback.
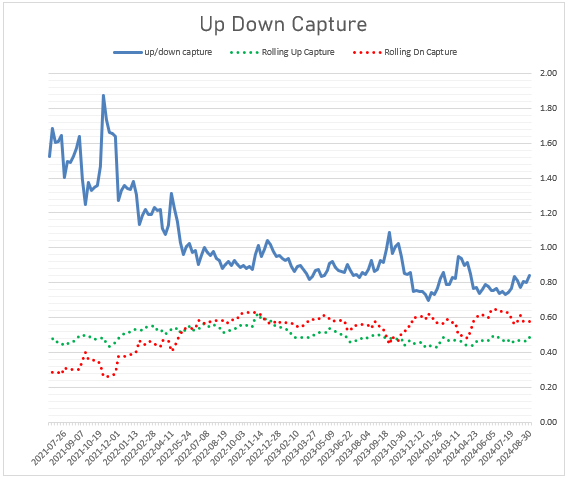
The individual legs of the ratio (up and down respectively) are far less than 1.0. That makes sense. JEPI is less volatile so it’s not going to go up as much as SPY or down as much. But the up/down ratio remains coherent since the lower volatility fact cancels out. You can see that the ratio starts off amazing, far greater than 1.0 but it starts to degrade and fall below 1.0 in July of 2022, about a year before the rolling Sharpe ratio succumbed to SPY.
Let’s look even closer.
We’ll scale the JEPI returns up to SPY returns by the inverse of the trailing vol ratio (so if JEPI is half the vol of SPY we’ll double its return to mimic a equal-vol weighted allocation).
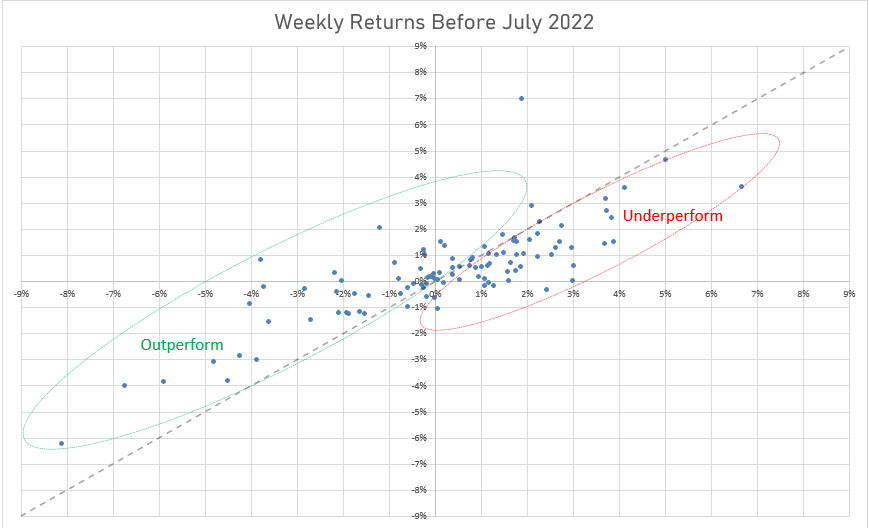
That healthy up/down capture is being driven by outperformance:
- during small moves which we expect since JEPI is short options
- on the downside even for large moves despite being short options!
Make no mistake, JEPI was working quite well.
What does it look like as it starts to degrade?
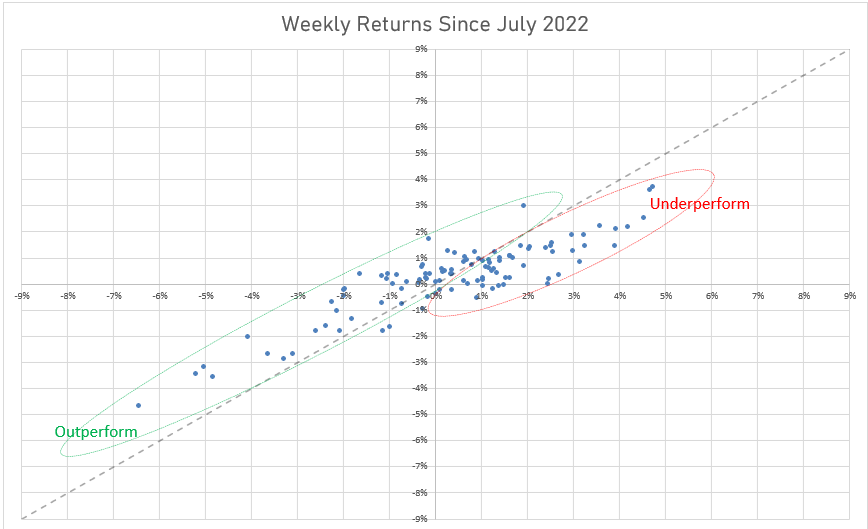
The underperformance on the upside looks similar. If you squint maybe the underperformance seems to be a bit worse for the +4% weeks but it’s not hitting you over the head and the frequency of those weeks is still small.
However, the outperformance on the downside moves is a much thinner green envelope potentially indicating that the call premiums being collecting are not buffering the downside as much as they used to.
A Tale of 2 Halves
JEPI has been around for 4 years. Like the Falcons in Super Bowl LI, it got off to a strong start. I remember leaving the party at halftime and by the time I got home the Patriots were on the verge of finalizing their historic comeback. The JEPI underperformance in its past 2 years isn’t the same as Atlanta’s defensive collapse but an up/down capture of .80 isn’t gonna fill the seats.
Or is it?
This was a lot of AUM growth in one year (red box):
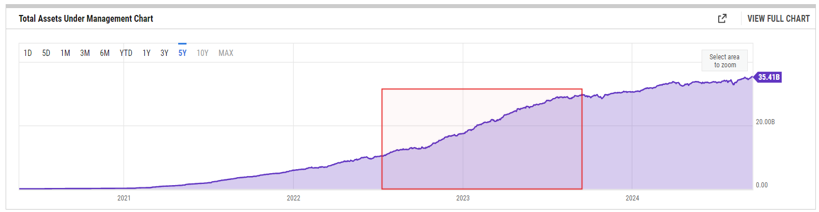
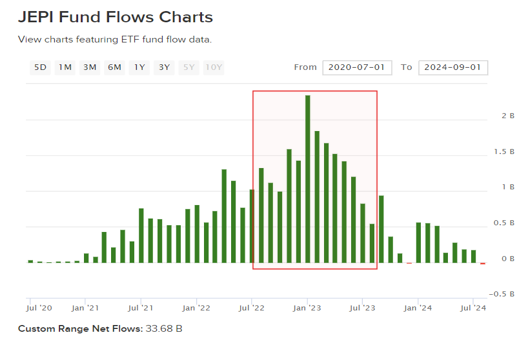
That’s a lot of new, easy to anticipate option premium for sale. This is not football. A big fanbase is not an advantage.
2024 was the first time any months saw an outflow and they were gnat-sized.
Wrapping up
This was a high level analysis. It demonstrates the value of up/down capture as another way to slice up performance. We examined what happened when a popular options strategy gained steam.
I don’t think this resolution makes crowding effects a conclusive cause of the performance degradation but my bias is definitely in that direction.
If you want to dig further, I left a lot uncovered:
- I didn’t even try to relate implied vols or skew data. (If you do this at the index level, you get noise from implied correlation readings.)
- You can reconstruct the holdings and do p/l attribution on options they sold if that’s available (or inferable).
I will run the same high level analysis for a few more derivative income ETFs: DIVO, JEPQ, NVDY, RYLD and XYLD. If their performance also followed the same gradient descent I’ll see how it lines up with their own respective AUM trajectories. Confirmation or divergence could both be interesting.
For now, I leave you with 2 final bits:
Covered Call ETFs: Shitburger With Extra Tax (9 min read)Brent Sullivan
The Tax Alpha Insider gets into the weeds of tax treatment of all kinds of investments. He spoke at CBOE’s RMC on the topic of taxes and derivative income ETFs.
Just to add a personal point. I have a rough heuristic of individuals being either markets people or structuring people. Traders vs lawyers. Contemporary folks like Matt Levine and Wes Gray are striking examples of people who understand both deeply and are actively sharing knowledge today. Henry Singleton would be on the Mount Rushmore for this breed of ambi-turner.
My brain isn’t on the same plane as these people but even on the rung I’m at I can’t build Ikea furniture or rotate a shape. I’d rather watch your 2-year-old than read a structured-product flowchart with the words “payor” and “receiver”. I hate thinking about taxes, entities, even real estate deals. Some people live for the words “generation-skipping trust”. My eyes glaze over.
I don’t use an FA, but accountants and lawyers are necessary balms. It’s good to see an account like Brent pop up since maybe I can at least get a glimpse of how much I don’t know.
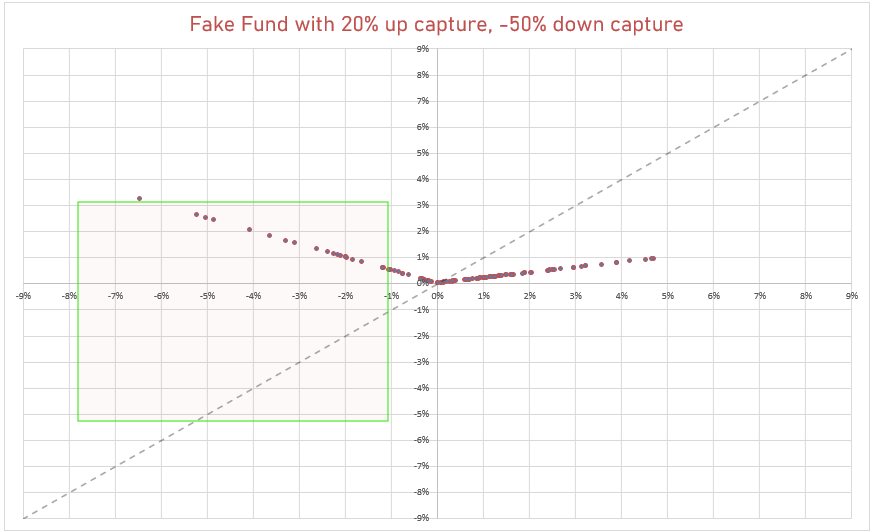
Up/down capture that’s worth a lot
I made up the numbers below, but it’s not that different from what a well-run relative value vol strat will look like using monthly data. Before fees at least.
But they are expensive because who wouldn’t want a positive carry put option. That green outperformance region buys a lot of fallen assets at depressed prices. Your assets are up, while liabilities are down. Double win.