
From Text ➡️ Dashboards
vibe code a silver dashboard
We’ll start with some useful resources for the learners, then move to material for traders ready to do stuff.
CME Trading Simulator
While looking up data on CME’s website I came across this amazing, 100% free learning environment with live ticking data:
https://www.cmegroup.com/education/practice/about-the-trading-simulator
Implied Forwards and Jensen (not Huang)
As I mentioned a few weeks ago, I’ve been re-publishing educational posts on X Articles which serves as spaced repetition practice for long-time readers or just bringing them to the attention of new readers who would be better served by a steady IV drip (no pun) of archival posts than attempting to raw dog the compendium.
These are 2 I think you’ll like:
From Text ➡️ Dashboards
I bought silver a year ago because of Alexander Campbell’s substack. He does a great job showing his thinking behind ideas with data and charts. This alone is helpful because it reveals “these are the datasets a smart guy pays attention to”.
AI tools are shortening the distance between “Hey, that’s neat, I should add that to my dashboard” and like actually adding it to your dashboard. Even if you stink at the world’s most popular coding tool —- Excel (see Will Claude Eat Excel?)
I used one of Alexander’s recent posts to whip up a silver dashboard. I’ll explain what I did, what I added, and share it with you so you can duplicate it as your own starting template. But the broader lesson is that agents are going to make all content “interactive”, we’re just not used to those patterns. Yet.
It is just another staple in my belief that as the cost of inference approaches zero the value of unique data increases. At one time oil was used for light and warmth. But when the automobile was born it claimed the largest cut of the barrel. If data is oil, more people everday are unlocking the ability to “refine” it by transforming it, building new logic and visualizations.
Let’s get to creating the dashboard.
One giant disclaimer:
Expectations are everything. AI is not going to one-shot this project. I’d estimate it reduced a 6 hour task to 90 minutes. Indulge my parental tone for a sec. It would be a mistake to permit this to let you work less in the spirit of that stupid Genspark AI Super Bowl ad. Instead, you should see this as “I can do 4x as many projects as I could before.” This may sound like hustle-porn (you know it when you see it, right?) but if that’s your attitude I offer 2 observations:
- You probably don’t like your work. If you do, then giant increases in productivity allow you to get even closer to the the best parts of your work.
- Regardless, this goldilocks period will end, everyone will know how to use the 21st century calculator, and 4x as productive will become the new baseline. Red queen. A very smart guy who used to work with me (he was the one who did a lot of the math and technical stuff that we’d need) works in real estate now. I suspect he’s in the top 1% of nerd in that industry. He recently applied for a job and failed a test that was intended to deomonstrate how resourceful he was in the context of AI tools. Knowing him as well I do, I found this shocking because he’s the kind of person that always does well on formal exams. Granted, he admits he’s not not using AI as much more than a google replacement. That this exam exists and a person like him failed, suggests the goldilocks period may already be drawing to a close. It’s not like real estate companies are living on the bleeding edge either.
On a positive note, I think you learn just as much in the compressed time as if you spent 6 hours. Instead of fumbling around with semicolons and syntax you learn how the internet is stitched together and how technologies talk to each other. Embrace manager mode.
Enough of that, moving on to the meat.
Step 1
Give Claude Alexander’s post Silver Moon.
Tell Claude to generate a dashboard in Google sheets inspired by all the arguments in the article. Examples include:
- SOFR Rate — funding cost baseline for carry trades
- Funding Rate — broker-specific borrowing cost (SOFR + spread)
- ETF Prices — SLV, GLD, UUP, SIL, SILJ for cross-asset context
- Derived Spot — London silver price via SLV ÷ oz/share
- Futures Curve — next 5 liquid contracts with live prices
- Expiry & DTE — days to expiration for roll timing
- Basis — futures premium/discount to spot ($, %)
- Annualized Carry — implied yield from contango/backwardation
- Shanghai Premium — China price vs COMEX (arbitrage signal)
- COMEX Inventory — registered/eligible silver (physical supply)
- COT Positioning — commercial vs speculative positioning (sentiment)
- SLV Shares Outstanding — ETF creation/redemption flows
- SLV Oz in Trust — physical silver backing
- Implied Volatility — options market fear/complacency
There are 2 key features that operate the sheet
Control Tab
We include a control tab for sourcing the relevant data. All of Alexander’s sources were public but whether you can automatically connect to them is another matter.
That’s why I like ot have a control tab which triages which sources are MANUAL, API, or SCRAPED.
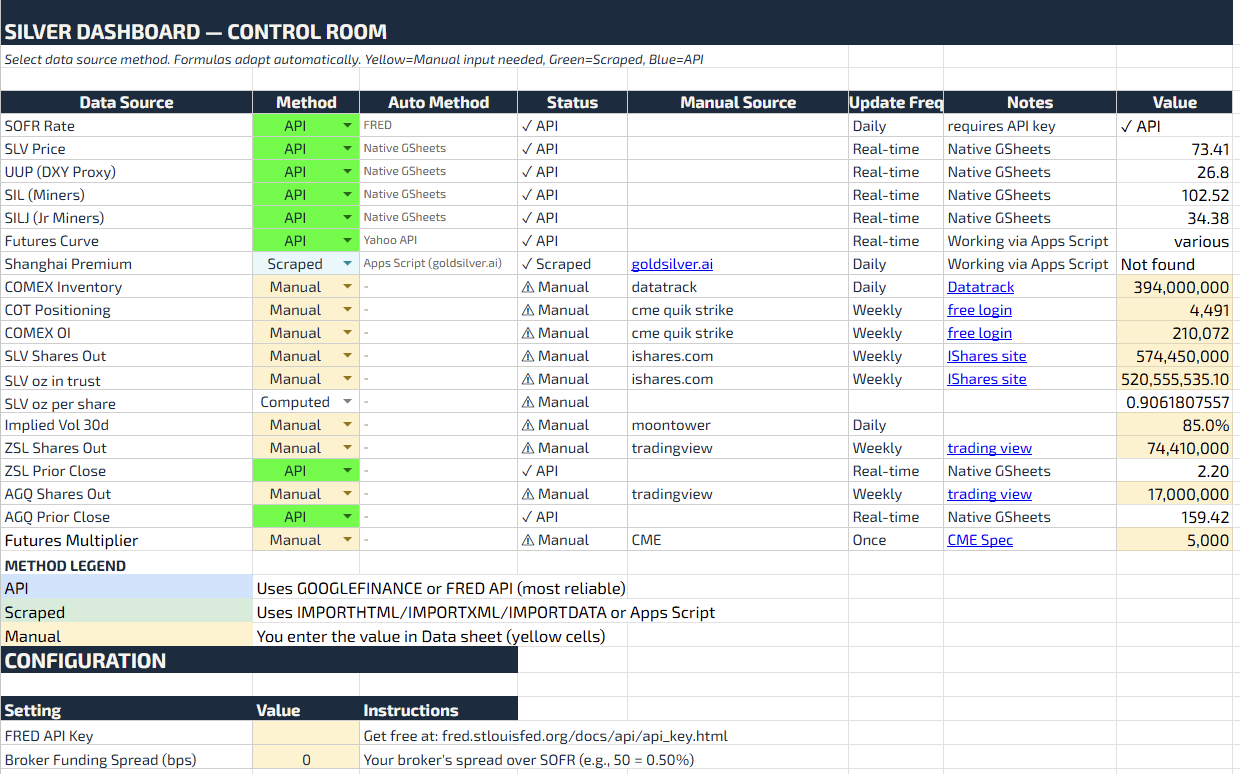
Google App Scripts
This is the equivalent of VBA behind Google Sheets but it’s in Javascript which Claude will happily write for you whether you want to wire the sheet up to APIs or scrape.
Step 3
Troubleshoot. Claude’s sheet gets you 75% of the way in moments and then you spend 90 minutes on this step.
Most of the scraping failed. Sometime because Claude referenced a stale website. But even when you update the correct URL you quickly find that financial data websites tend to lockdown the ability to scrape.
I worked through each data source, iterating with Claude to find automatic (and free) solutions or writing AppScripts usually falling back to “manual” when necessary.
Finally, as I made changes to the spreadsheet there’s the expected debugging and tracing of formulas that happen whenever you delete stuff from a sheet someone else (in this case a bot) made. Pound ref and N/A always show up for a gangbang.
Step 4
Add spice to taste.
Alexander + Claude leapfrogged a lot of work. But there’s still plenty of room for your own judgement and creativity.
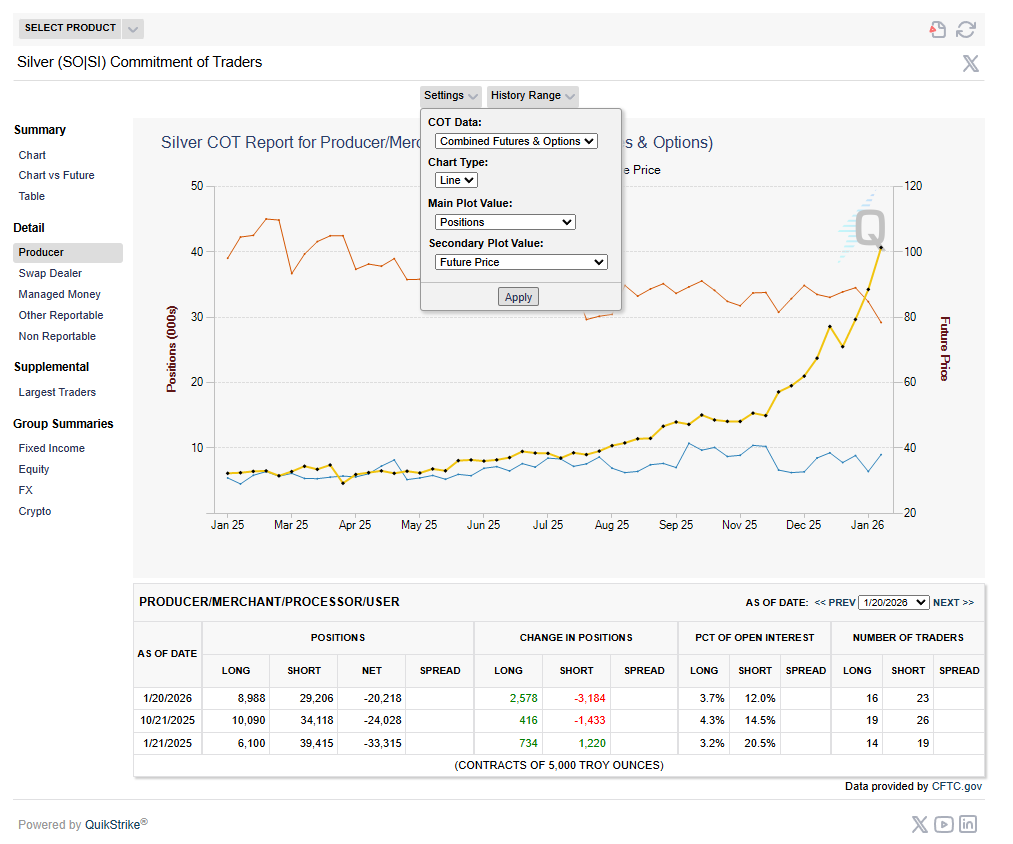
For example, when it comes to COT I use the fantastic tools on the CME website which aggregate both futures and options positioning.
I also added leveraged ETF tickers and logic that estimates how much silver there is to buy/sell based on their daily rebalances and even a first pass at computing market impact (see appendix).
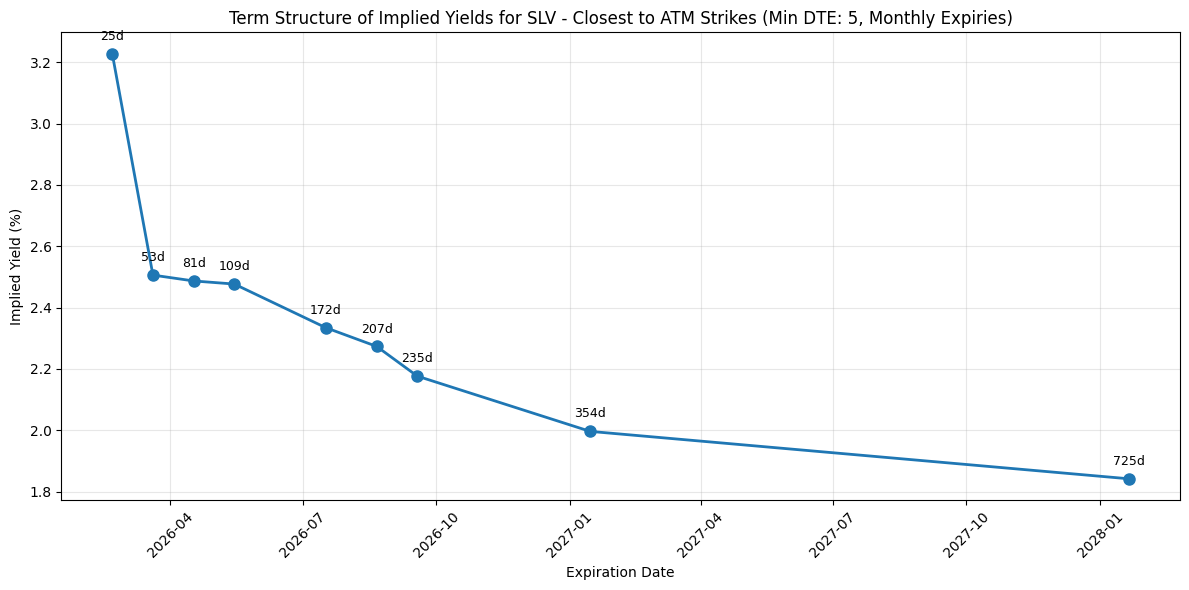
Finally, I included a placeholder picture to compute the implied term structure from the SLV options term structure by backing out hard-to-borrow rates.
The google sheet is mostly self-explanatory but even if you get stuck just use Gemini in sheets or the Claude extension in a browser to mentor you along.
Here ya go: