
Eagle-eyed chart reader
why you must use log charts for looking at compounded returns
Benn posted a great question:
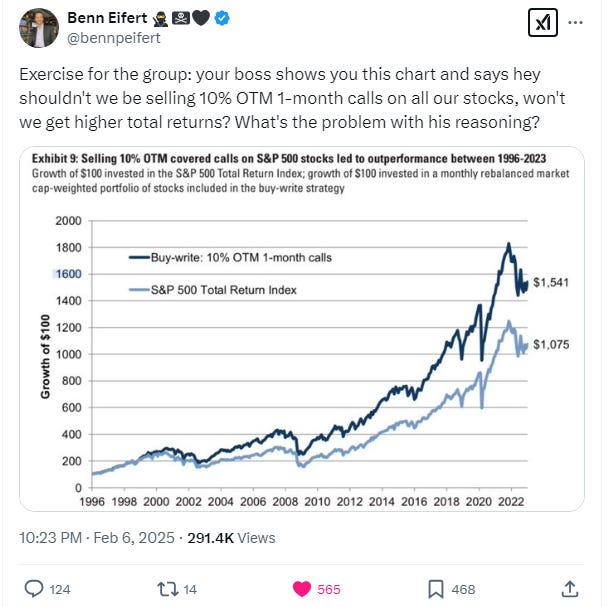
First, there are many responses in the thread that bring up terrific points regarding how taxes and transaction costs would treat these strategies very differently. Those were the caveats I thought of too.
But there is a glaring issue that’s very hard to spot. It did not pop out to me nor many others.
Try to find it yourself.
Alright, I’ll hand it off to Nick, one of the few who saw it right away:
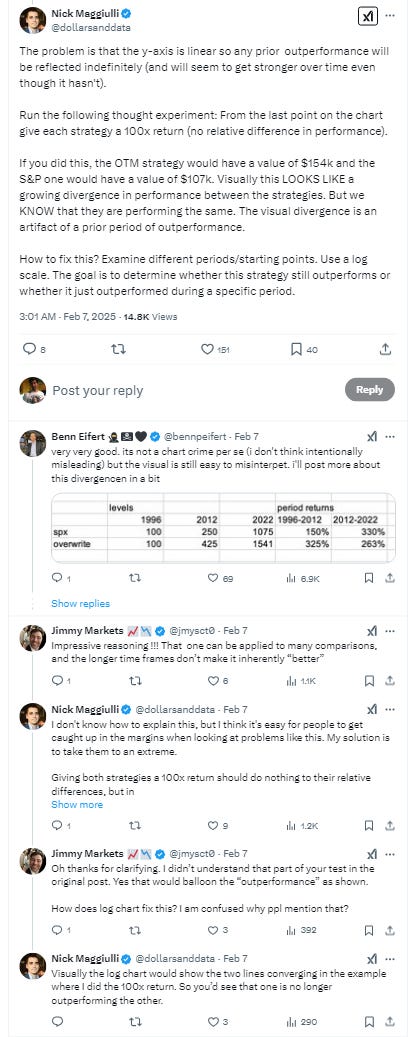
What’s tricky about this comes back to what Benn says…it’s not an intentional chart crime. We probably get fooled by this all the time. As Nick and Benn explain in the thread, the trick is to use log scaling on the y-axis because we are dealing with a compounding (ie exponential) process.
Let’s do that.
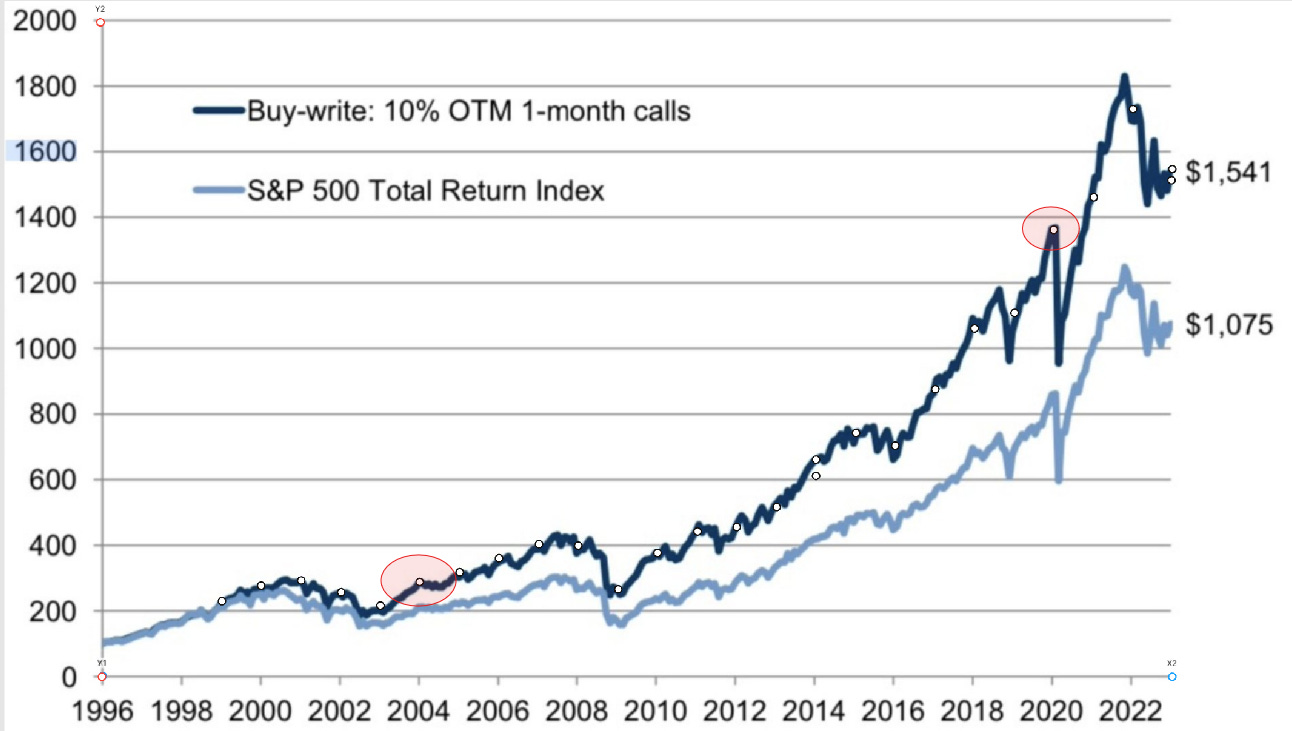
Step 1: Extract the returns at annual intervals using plotdigitizer.
I pasted the chart in the app, labeled the axes, and simply click on a date in early January each year. The app returns the x and y coordinates for export. (It’s tedious because I had to do it for each line separately but I think you can buy the software and it will auto-trace it.)
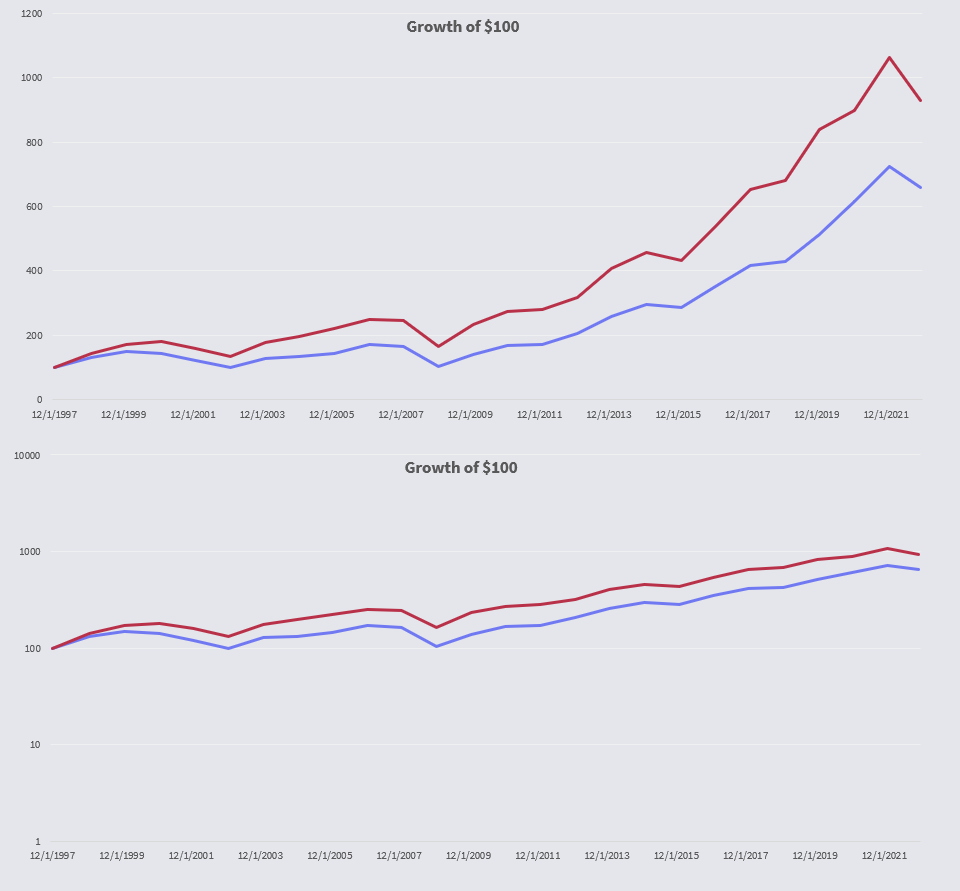
Step 2: Chart in Excel
I simply charted the tables starting from the start of 1998 when the lines were about to start diverging (I re-denominated all the data back to the start of 1998). Here you can see both the 1998-2023 chart on the original Y-axis and on a log Y (base 10) axis:
The log scaling reveals that the early lead of the call overwriting-strategy does not widen over time as the original chart suggests. In other words, all the gains were in the beginning.
This is not surprising to option traders. Vol selling has been wildly in vogue since the current millennium became a teenager. The asset management world noticed that it performed well and then created a ton of product based on those results.
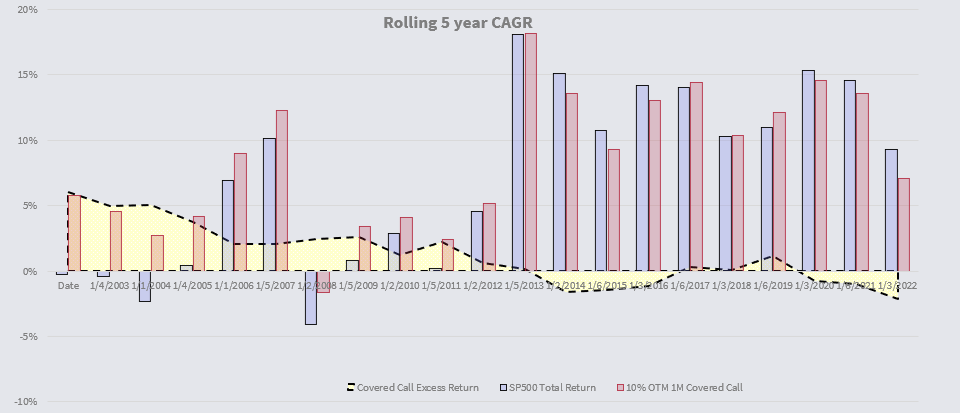
Using the same data, here’s a rolling 5-year CAGR which shows the story. The yellow section is the outperformance/underperformance of call-selling vs buy-and-hold.
The broader lesson: your eyes will be more trustworthy, if you plot compounded returns with log scaling.
💡Learn more
- Chart Crimes (2 min read)
- Getting Comfortable With Log Charts (3 min read)