
Do Professional Investors Understand Fees?
Non-obvious relationships between volatility and management fees
Fees Are In Focus
Retail
Giant fund manager/brokerages like Vanguard and Fidelity have made fees front and center. Like Walmart, if you are the lowest cost provider and wield blue whale scale, you are going to compete on price. Competition has spurred a race to the bottom on fees. With many investment choices commoditized, the focus on fees has served customers well.
If I wanted to nit-pick, I might say investors don’t fully account for more opaque fees when choosing funds. These can swamp the management fees. Turnover, slippage costs, borrowing costs and abysmal sweep account rates all have significant impacts on net performance. These hidden costs are not easily reduced to a number that can be compared to a management fee. Hint: it’s a good place to search for how managers are able to drive fees to zero. But that’s a digression. I’m not especially interested in retail. Their financial advisors are doing a good job using steak and wine to box out the fund managers. There’s only so much fee to go around.
Professionals
Allocators have a more difficult job. They devote teams to parsing alternative investments. A sea of private investments and complex hedge fund strategies. Within that context the allocators must construct portfolios that trade-off between tolerable risks and the probability of meeting their mandates.
The allocators rummage through a diverse mix of strategies each with their own mandates. Growth, wealth preservation, defensive, hedged alpha. A fund can be thought of as a payoff profile with an associated risk profile. A thoughtful allocator is crafting a portfolio like a builder. They want to know how the pieces interlock so the final product is useful and can withstand the eventual earthquake.
A builder cannot think of materials without considering cost. Wood might make for a better floor than vinyl but at what price would you accept the inferior material? When builders estimate their costs they must consider not only the materials, but transportation costs and how the cost of labor may vary with the time required to install the material.
So let’s go back to the allocators. If the menu they were choosing from wasn’t complicated enough, they must also evaluate the costs. This is a daunting topic. They face all the opaque costs the retail investors face. But since they are often investing in niche or custom strategies that are not necessarily under a public spotlight they have additional concerns. A basic due diligence process would review:
- Which costs are allocated to the GPs vs the LPs
- Liquidity schedules
- Fund bylaws
- Specific clauses like “most-favored-nations”
- Netting risks¹
Unlike their retail counterparts, the professional investor’s day job is devoted to more than just investments but terms. Like our builder, this cannot be done faithfully without understanding the costs. Mutual funds sport fixed fees but complex investments often have incentive fees (a fee that is charged as a percentage of performance, sometimes with a hurdle) making them harder to evaluate. Regretfully, I suspect a meaningful segment of pros do not have a strong grasp on how fees affect their investments.
Understanding Fees
While it is challenging to price many of the features embedded in funds’ offering documents, there is little excuse for not understanding fees whether they are fixed or performance-based. After all, if you are an investor this is one of the most basic levers that affect your net performance and does not rely on having skills. It’s a classic high impact, easy to achieve objective. It’s the best box in that prioritization matrix that floats around consulting circles.
Let’s take a quick test.
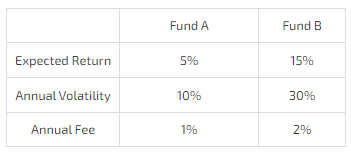
You have a choice to invest in 2 funds that have identical strategies.
They have the same Sharpe ratio of .5
There are 2 differences between the funds. The fee structure and volatility.
Let’s assume the excess volatility is simply a result of leverage and that the leverage is free.
Which fund do you choose?
Normalizing Fees By Volatility
The correct way to think about this is to adjust the fee for volatility.
- Fund A’s fee is 10% of its volatility (1% / 10%).
- Fund B’s fee is 6.7% of it volatility (2% / 30%)
If you doubt that Fund B is cheaper from this reasoning you could simply sell Fund A and buy 1/3 as much of Fund B.
Let’s use real numbers. Suppose to had a $300,000 investment in Fund A. You would be paying 1% or $3,000 in fees.
Instead, invest $100,000 in fund B. Your expected annual return and volatility would remain the same, but you would only pay 2% of $100k in fees or $2,000. Same risk/reward for 2/3rd the price. Compound that.
I am not alone in this observation. From his book Leveraged Returns, Rob Carver echoes that a fund’s fees can only be discussed in context with its volatility:
I calculate all costs in risk-adjusted terms: as an annual proportion of target risk. For target risk of 15%/year and costs of 1.5%/year, your risk-adjusted costs are 1.5%/15% = 0.10. “This is how much of your gross Sharpe ratio will get eaten up by costs.
A Clue That Some Allocators Get This Wrong
Allocators will often target lower vol products for the same fee when a higher vol fund would do. To be fee-efficient they should prefer that managers ran their strategies at a prudent maximum volatility. Optimally some point before they were overlevered or introduced possible path problems. There are many funds and CTAs that would just as easily target higher volatility for the same fee. Investors would be better off for 2 reasons:
- Allocators could reduce their allocations
As we saw in the Fund B example, it is more fee-efficient for vol targeting to be done at the allocation level not the fund level. - Limit cash drag.
They would stop paying excess fees for a fund that had been forced to maintain large cash reserves since it was targeting a sub-optimal volatility. Why would an allocator be ok with paying fees for funds that are holding excessive t-bills?
If you are not convinced that investors’ preference for lower vol versions of strategies demonstrates a lack of fee numeracy then check out this podcast with allocator Chris Schindler. As an investor at the highly sophisticated Ontario Teachers Pension he witnessed firsthand the folly of his contemporaries’ thinking around fees. While mingling at conferences he would hear other investors bragging that they never pay fees above a certain threshold.
As we saw from our example, these brags are self-skewers, revealing how poorly these managers understood the relationships between fees and volatility. Not surprisingly, these very same managers would be invested in bond funds and paying optically low nominal fees. Sadly, once normalized for volatility, these fees proved to be punitively high.
This brings us to our next section. How would you like to pay for low-volatility or defensive investments?
Tests to Compare Fixed Fee Funds with Incentive Fee Funds
A Low Volatility Example
Let’s choose between 2 identical funds which only vary by the fee structure.
Both funds expect to return 5% and have a 5% volatility. Yes, a Sharpe ratio of 1.
- Fund A charges a fixed .75%
- Fund B charges 10% of performance from when you invest. Fund B has a high watermark that crystallizes² annually.
Which fund do you choose?
A Large Cap Equity Example
This time let’s choose between funds that have SPX-like features
Both funds expect to return 7% and have a 16% volatility.
- Fund A again charges a fixed .75%
- Fund B again charges 10% of performance from when you invest. Fund B has a high watermark that crystallizes < annually.
Which fund do you choose?
Studying The Impact Of Fee Structure
I wrote simulations to study the impact of fees on the test examples.
The universal setup:
- Each fund holds the exact same reference portfolio
- 10 years simulation using monthly returns
- Random monthly returns drawn from normal distribution
- 1000 trials
- Fixed Fee Fund charges .75% per year deducted quarterly
- Incentive Fee Fund charges 10% of profits crystallized annually
Case 1: Low-volatility
Simulation parameters:
- Monthly mean return of .42% (5% annual)
- Monthly standard deviation of 1.44% (5% annually)³
This chart plots the outperformance of the fixed fee return vs incentive fee return fund annually vs the return of the portfolio which they both own. The relative performance of the 2 funds is due to fees alone.

Observations
- It takes a return of about 7% or higher for the fixed fee fund to outperform.
- This makes sense. A 75 bp fee is difficult to overcome for a 5% vol asset.
- If the asset returns 5% the performance fee would only be 50bps and we can see how the difference in fees approximates the underperformance of the fixed fee fund for 5% level of returns.
Case 2: Large Cap Equity Example
The universal setup remains the same.
We modify the simulation parameters:
- Monthly mean return of .58% (7% annual)
- Monthly standard deviation of 4.62% (16% annually)

Observations
- Most of the time the fixed fee fund outperforms. So long as the return is north of about 4% this is true.
- The most the fixed fee fund can underperform is by the amount of the fixed fee. Consider the case in which both portfolios lose value every year. The incentive fee fund will never charge a fee, while you will get hit by the 75bps charge in the fixed fee fund. You can see these cases in the negative points on the left of the chart where the portfolio realizes an annual CAGR of -5%.
- Conversely, the incentive fee can be very expensive since it captures a percentage of the upside. In cases where the underlying portfolio enjoys +20% CAGRs, the simple fixed fee fund is outperforming by about 150 bps per year.
Bonus Case: The High Volatility Fund
Finally, I will show the output for a low Sharpe, high volatility fund.
The universal setup remains the same.
We modify the simulation parameters:
- Monthly mean return of .42% (5% annual)
- Monthly standard deviation of 10.10% (35% annually)

Observations
- This case demonstrates how complicated the interactions of fees and volatility are. The fixed fee fund will massively outperform by even as much as 200bps per year when the portfolio compounds at 20% annually.
- The fixed fee fund even outperforms at low to mid single-digit returns albeit modestly.
- The high volatility nature of the strategy means lots of negative simulations, thanks to geometric compounding (for further explanation I discuss it here). When a fund performs poorly you pay less incentive fees so it’s not surprising that in many of these case the fixed fee fund underperforms by nearly the entire amount of the management fee.
Takeaways
Fixed Fees
- Best when the volatility of the strategy is high and the returns are strong (again you are warned: most high volatility strategies don’t have strong returns because of geometric compounding).
- The most a fixed fee investor can underperform an incentive fee investor is by the amount of the fixed fee.
Incentive Fees
- Best when the strategy is low volatility or returns are negative. Or the asset is defensive in nature. For hedges or insurance like funds, you may prefer to pay a performance fee to minimize bleed.
- The amount an incentive fee investor can underperform is technically unbounded since it’s a straight percent of profits.
General
- Fee structures must be considered relative to the volatility and goals of the strategy. There are no absolutes.
- By dividing fixed fees by the fund’s volatility you can normalize and therefore compare fund fees on an apples-to-apples basis. Even seemingly low fixed fees can be very expensive when charged on low volatility funds.
- Incentive fees look like long options to the manager (which implies the investor is short this option). The investor has unbounded potential to underperform a fixed fee solution and can only outperform by the amount of the fixed fee (the left hand side of those charts). To further study the embedded optionality of incentive fees see Citigroup’s presentation.
- Incentive fees are meant to align investors and management. Who can argue with “eat what you kill”? But they can also create bad incentives. If trapped below the high watermark, the manager has nothing to lose and may swing for the fences irresponsibly. In addition, a staff working at a fund that is underwater might be dusting off their resumes instead of focusing on getting back on track knowing that they need to work through uncompensated p/l before they see another bonus.
- Fixed fees can encourage management to diversify or hold more cash to lower the fund volatility. These maneuvers can be combined with heavy marketing in a strategy more colloquially known as “asset-gathering”.
Conclusion
Fees need to be considered in light of the strategy. This requires being thoughtful to understand the levers. Unless you are comparing 2 SP500 index funds, it’s rarely as simple as comparing the headline fees. If we all agree that fees are not only critical components of long-term performance, while being one of the few things an allocator can control, then misunderstanding them is just negligent. A one size fee doesn’t fit all alternative investments so a one size rule for judging fees cannot also make sense. Compared to the difficulty of sourcing investments and crafting portfolios getting smart about fees is low-hanging fruit.
Footnotes
- For a nice discussion see https://www.pionline.com/article/20140523/ONLINE/140529928/netting-risk-not-widely-understood
- Note on high watermarks and crystallizationCrystallization is the point in time when the manager determines and charges the performance fee. A fund’s high watermark (HWM) is set by the NAV from the most recent crystallization date.For example, suppose the manager crystallizes the fee on Dec 31, 2019. If the fund’s NAV is $100 on that day, that establishes the HWM. Then on Dec 31, 2020 if the fund NAV is below $100, there is no performance fee charged. If the fund NAV reached $105 during the year but then dove to $95 the HWM is still $100. If the fund is worth $105 on Dec 31, 2020 then Fund B would charge $.50 or 10% on $5 (the difference between the crystallization price of $105 and the previous HWM of $100). Note the new HWM is technically $104.50, the after-fee price set on Dec 31, 2020.
- Monthly vol = Annual Volatility / sqrt(12)