calendar spreads through the eyes of a vol trader
simulating a time spread
I got long IBIT (BTC etf) when my April calls expired ITM. IBIT continued rallying, I was happy to stay long. However, the vol screened cheap.
I decided to “replace” — I sold my long shares and bought calls.
Deciding which calls to buy was tricky. So tricky it inspired this post.
The heart of the conundrum lives in this snapshot from 4/23/25:
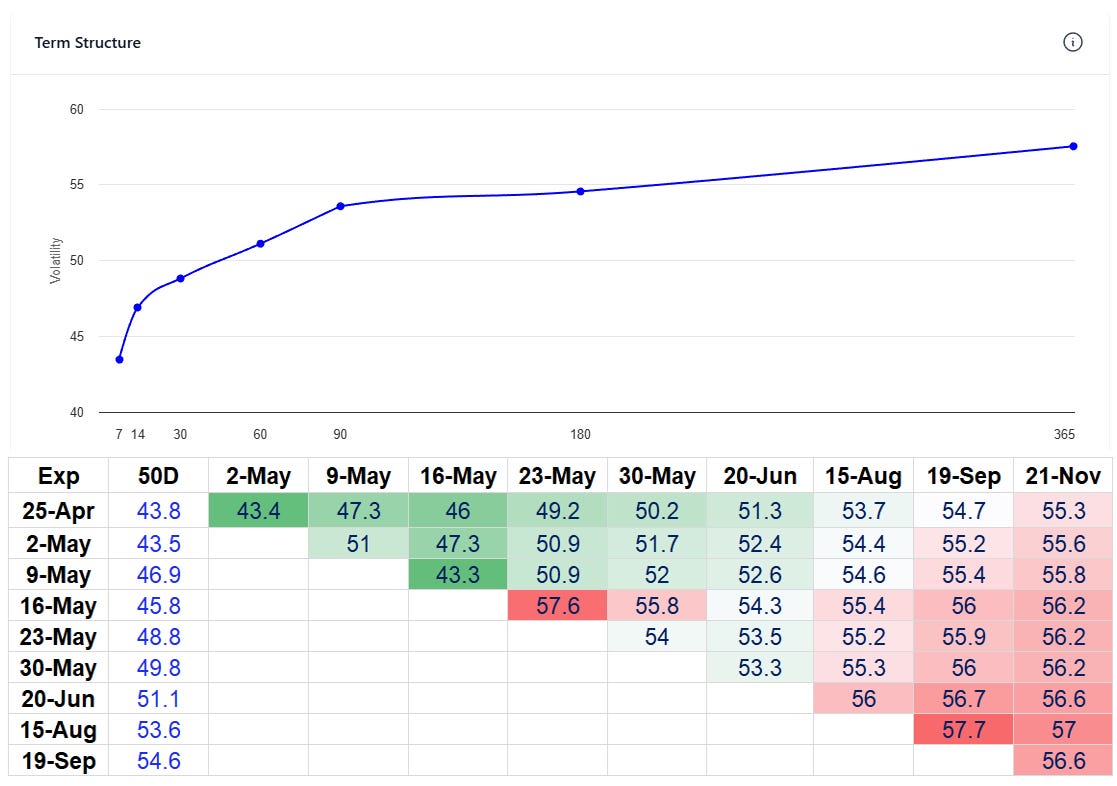
That is the constant maturity IV term structure, visually depicting a steep term structure. The implied forwards table below it gives a more granular view.
You can see the problem.
I think vol is cheap…but that was confined to the front of the curve. If we just look at the first 2 monthly expirations, May 16th and June, the vols are 45.8% and 51.1%.
The premium from May to June is so steep that the May/June forward vol was 54.3%, a full 10 points over the weekly IV!
Vol might be cheap but you can only “lock” it in for about a month. Then it doesn’t look so cheap anymore. No easy trades, right? The market is pricing mean reversion in the vol.
I chose to go with what the market gave me — the cheap vol in the front. I sold my shares and bought the May 60 calls.
Well, the stock went up about 15% that month…but expired just below my long strike.
A 15% move in a month corresponds to a 52% vol move (.15 x √12) but I picked the wrong strike. Path is Anton Chigurh’s coin.
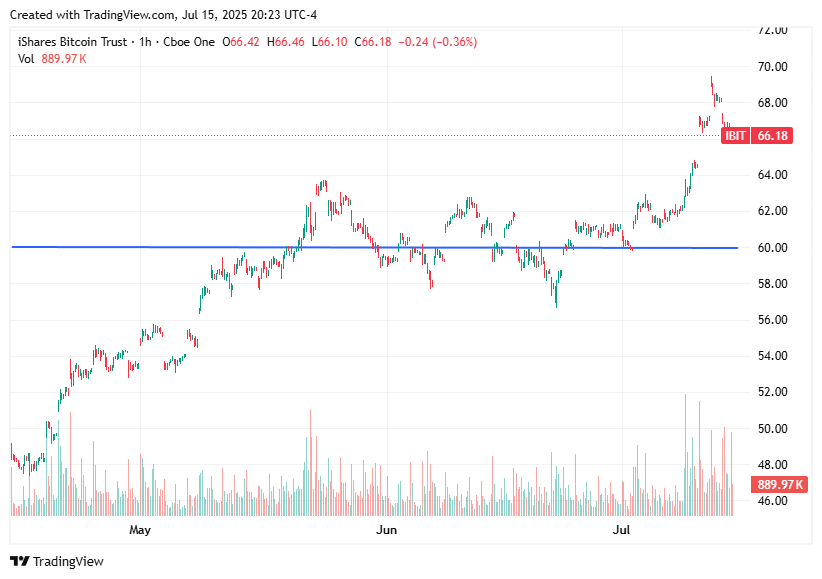
I chose the shorter expiry because that’s where vol was cheap. June was 5 vol points richer, more than 10% premium over a single month. Is that too much to pay? Does that nullify the “vol is cheap” thrust behind the trade idea?
There’s no straight answer to such a question.
The term structure balances a tension between the supply and demand in each month. Those flows are made up of both natural needs — directional speculation, hedging — and vol trader positoning insofar as they have opinions on the relative pricing.
The term structure is the jurors’ debate of the evidence. The truth behind the case, just like any trial is not perfectly known. In the market’s case, the ensuing price action, represents the truth.
Discerning between months and trading time spreads is a significant portion of vol trading. Understanding events is a mix of computation and research labor. There’s room for alpha in the act of normalizing term structures to account for idiosyncrasies in a calendar.
But let’s put that aside and assume a calendar with no known events.
We want to build some intuition of expensiveness or cheapness in a time spread. We can use a toy calculation to do this in the context of a common scenario:
“I am buying a time spread to harvest the front-month VRP”
If you sell the front month and buy the back, it’s a hedged way to capture the premium of implied to realized.
Note this premium, despite being empirical, is neither constant in magnitude nor size, but simply “on average”. Still, we can use this type of trade to explore the tradeoffs in month selection.
When we buy say, an ATM time spread, we are going to be long vega, long time premium, short gamma, and generally collecting theta.
Wait.
Why am I bolding “generally”?
It’s a clue to the tradeoffs involved.
Let’s just jump right into the toy model to see what we can learn about time spreads. This is stuff that excites, transfixes, and haunts every vol trader.
“What needs to be true for this time spread to be cheap or expensive?”
This will be the first in a few posts as I try to eventually turn this into a webapp.
We need to build a simulation.
We are angling towards an appreciation for how a time spread behaves by decomposing how a time spreads perform until the first month’s expiration as a function of:
- implied vs realized
- change in M2 vol if it “rolls” towards M1 vol by the time it becomes M1
We understand that buying a time spread should win if the realized vol underperforms the M1 vol you are short, but you are often paying a premium vol for M2 (contango term structure) and we want to see for various combinations of steepness between the 2 months and VRPs how attractive it looks to buy/sell time spreads.
The toy simulation
Scenario:
Consider a $100 stock that moves at 16% vol.
You buy a 40 DTE /20 DTE 100-strike calendar spread delta-neutral. 19.2% in the back month and sell 19.2% vol in the front month. Hedge daily at the close.
It’s a flat vol time spread.
You are trying to capture a VRP by being short 19.2% vol when the moves will be sampled from a 16% vol return distribution. Since you are short the nearer-dated option you should win if implied vol > realized vol since the moves are not large enough to cover the option theta.
How can we model this?
We can look at the daily delta-hedged p/l of a time spread assuming M2 vol converges to M1 vol by the time M1 expires. In our current example, M2 vol = M1 vol so there’s no “roll down”.
Today, we will simply zoom in on what a single simulation looks like.
Step 1: Stock process
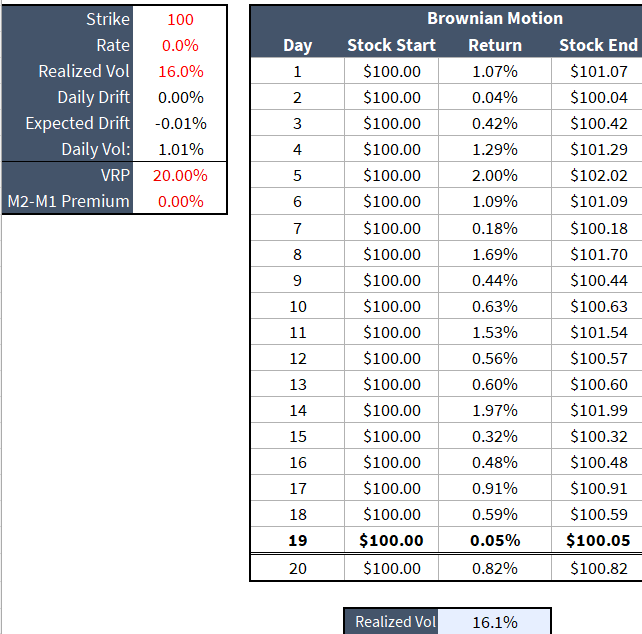
Assuming we pull a random return from a Brownian motion diffusion process with RFR = 0% and a daily vol of 16%/sqrt(251) or 1.01%
This is simple to implement. The details are here:
🔀Stock diffusion model explained step-by-step
Step 2: Daily strike reset
While the simulation has randomness based on the draw of daily moves, I’d like to minimize the dependency on path. If you trade the $100 strike and the stock trends away from your strike, your greeks “go away”. To get rid of this noise, we will reset the stock to $100 each day so that the options are once again at-the-money.
We will also assume the stock only goes up. We get the random return and assume the stock goes up by that amount. We are resetting the strike each day to whether the move is up or down makes no difference.
Bringing step 1 and step 2 together is an example of a single draw:
💡Quiz question
I computed a realized vol of 16.1% from that return stream. Do you get that same value? If not, what do you think I did and why? The answer is one of those things that makes you realize just how subtle choices in measures can have surprisingly large impacts.
Step 3: Compute daily p/l
We assume a constant implied vol for M1.
If M2 differs from M1 we assume a linear glide path for M2 to approach M1 by the time M1 expires. For example, if M1 has 20 dte and is 20% while M2 is 22%, then M2 vol will fall by .10 per day (2 vol points / 20 days).
Each day we start with a delta-hedged position on the $100 strike. We are short M1 and we assume the stock goes up by the randomly drawn amount from the diffusion process. So we will lose on the short call and win on the long stock. For M2, the opposite will happen — we win on the long call and lose on the short stock.
(I broke them out separately because it will be handy for decomposition but in reality, the long and short stock legs would be close to canceling out since it’s an ATM call spread.)
We can understand how this works for both long and short legs by just zooming in on M1 as an example.
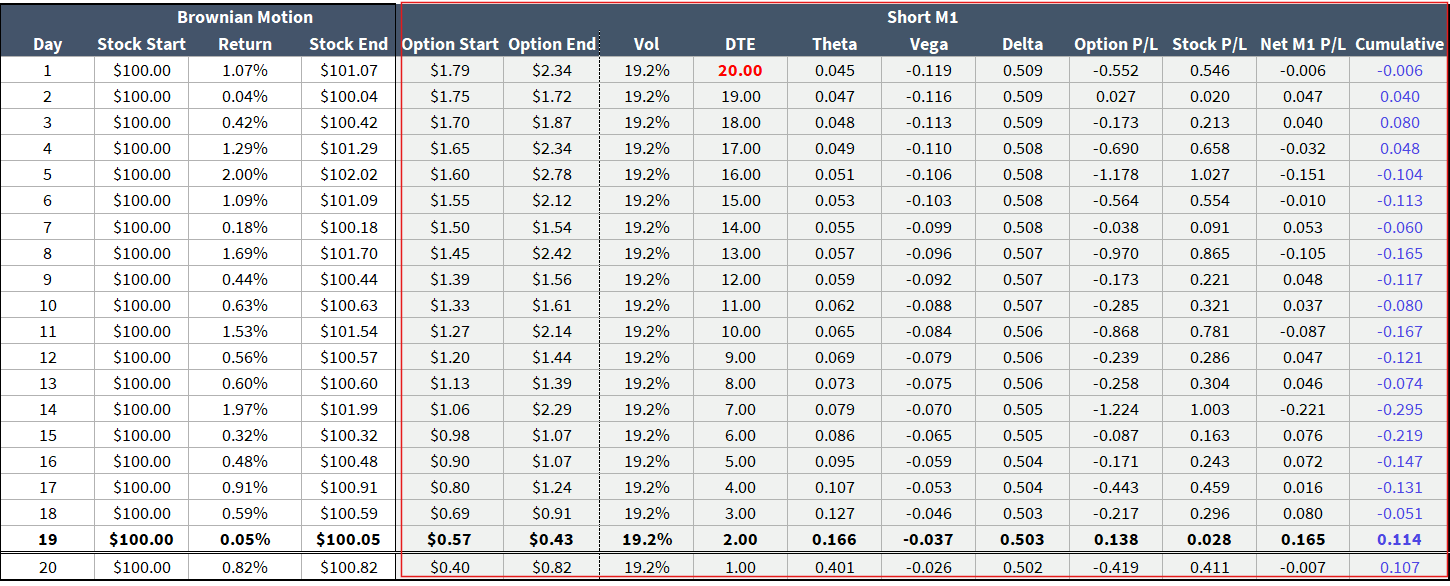
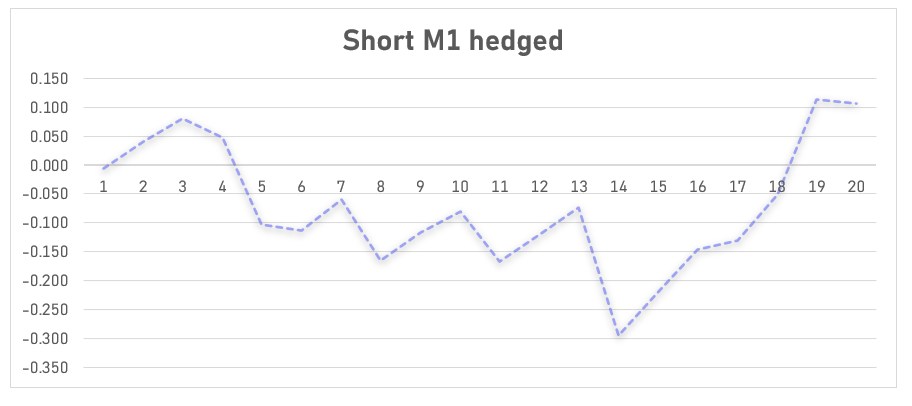
Being short M1 at 19.2% IV while it realized 16.1% (20% vrp) yielded a profit of about 11 cents. You can see the messy p/l path and this is with the strike resetting to ATM each day which sterilized the stock path!
Doing the same procedure on M2, we can see the breakdown:
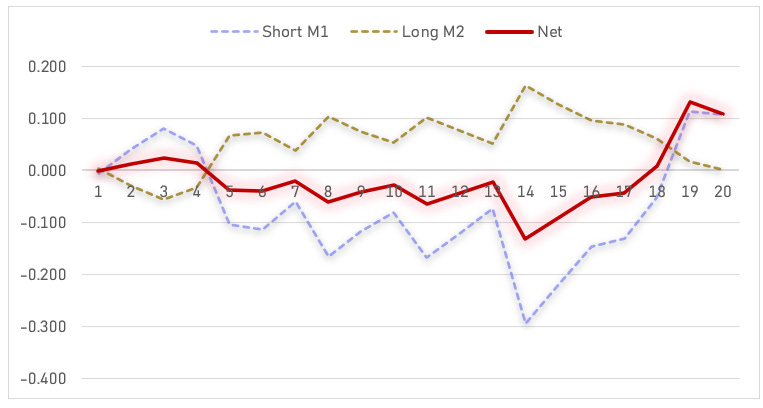
The long leg broke even while the short won. Although the win was driven by very small moves towards expiration.
I can’t overemphasize how noisy this is. The stock can sit unchanged for 19 days then on day 20 your short ATM call, which starts the day worth $.57, can blow out on a $4 rip, leaving you net loser on the whole trade. You were short vol at 19.2% and that hypothetical return stream is about 14% vol. Bad beat on the river.
(Yes, $4 is extreme but so is being unchanged for 19 days.)
The stock returns of those last few days before expiry get averaged into the realized vol calcs the same as any other day, betraying lived experience — your dollar gamma is so high near expiry that those returns have a disproportionate impact.
Which is exactly why nobody get outs alive from the fact being short where lands and vice versa will dominate everything else…hence my IBIT calls that were directionally right AND priced cheaper than the vol realized and experienced a total loss.
Here’s another draw, this one snatches defeat from the jaws of victory…
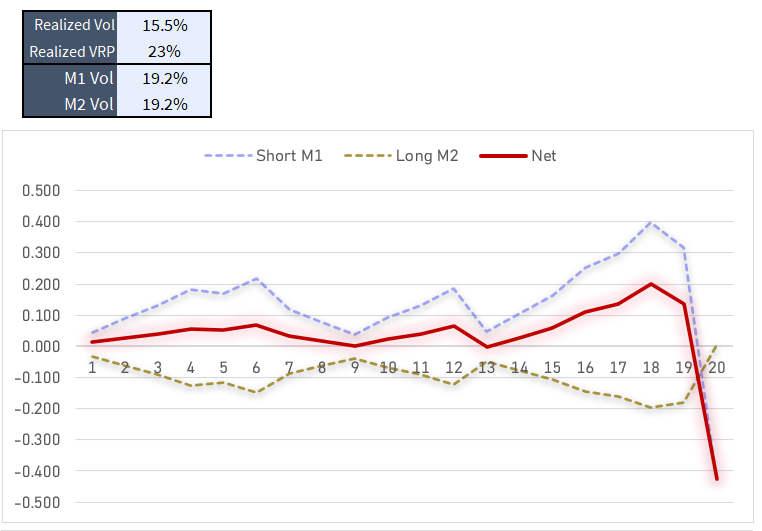
Healthy VRP. Sitting pretty with a cumulative profit 1 day before expiry and boom a 2.3% pop in the stock. A bit over 2 st devs. On that day you make 1/2 the move in share p/l because you do have the .50 delta hedge but the call you are short goes from $.57 to $2.30. Your M2 options have far less firepower so they only mitigate about 1/4 of the day’s loss.
So far we’ve stuck to the case where the time spread has flat vol (ie M1 IV = M2 IV). We’ll change that next week, when we get into “shadow theta” as we push ahead to understand calendar spreads.
