
building an option chain in your head (part 1)
On my way to Portugal, I was stuck on a plane with no internet and was thinking about hedging downside market exposure. You know, like you do when you’re stuck on a plane.
I know vols are in the toilet and to use a phrase from option broker Dean Curnutt — “buy umbrellas when the sun is shining”. It probably didn’t help that I also nodded along to Alexander’s post Time to Hedge?
Choosing the specific hedge is a fingertip exercise in looking at the metrics (the whole raison d'etre for moontower.ai in the first place was to reclaim the vol lens I lost when I left daily trading) and combining what they say with the personal biases I express in my portfolio.
Puts tend to be expensive. And when the vols are low, the skew can firm keeping the expensive puts much stickier than the rest of the surface especially longer-dated where the contango steepens.
There are times when you can buy puts without holding your nose but they tend to be rare (the rare easy trade was the risk-reward of owning skew on a heavy delta in late 2018 as it got very cheap. The street was choking on supply originating from the structured note market).
OTM calls on the other hand can get very cheap in grinding rally like we’ve been experiencing. Put-call parity is a timeless reminder that you can hedge downside even with OTM calls by simply selling your stock and replacing some or part of the exposure with long calls. This is a bearish or hedged posture that sacrifices small upside (the distance between the current spot price and the strike) in exchange for profiting in any large move scenario. With vols so low…by “large” I mean “historically intermediate”. Thank you market for uncautiously trying to wring out every last bit of risk premium. If the world is as great as the options market implies than being employed or running your business will harvest that reality. Not sure the logic of doubling down on exuberance in the ole’ PA but everyone’s got a different appetite.
Mark’s observation below highlights just how goofy the risk-reward on calls is screening.
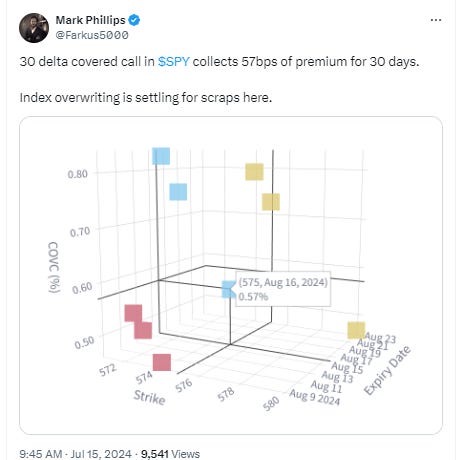
If you thought the actuarial fair value of those calls were 80% of the premium then you are collecting less than 15bps of "edge" per month before transaction costs. Instead you could use what the market is giving you. Sell some amount of your shares, use the interest on the proceeds to buy calls to dial in the delta you want.
(Mark has written a good post about this btw: Structured Product Toolkit)
But I digress.
Back to the airplane musing.
I was trying to back-of-the-envelope estimate how much, in percent terms, it would cost to insure my portfolio against certain moves. I had a sick, sleeping kid in my arms. No internet. No calculator with Black-Scholes programmed into it. It was going to be mock trading style mental math. If options are a bicycle for the mind, these are the trips that strengthen your betting and structuring intuition. As we step through this it will re-define what an option spreads means to you and strengthen your understanding of how options relate to each other (fyi this is part 1 of 2).
Before we get into that, I’ll remind you that options thinking is an incredible tool for thinking about arbitrage and relative value.
This post on mock trading offers a game-like, socratic description of the stream of thinking that relative value trading asks you to embody:
The collateral damage of this type of thinking is stuff like this will bother you:

Back to the mental option math I was forced to consider since I had no patience to wait for an internet connection. Whether you have no phone on you or just prepping for a job interview, stepping through the following progression will (re)wire your off-the-cuff mental pathways as you ponder prices and odds.
I’m going to run through this quickly as you might in an impromptu situation. I’ll be making estimates and rounding liberally as you do when thinking approximately.
The problem
You’re sitting there wondering how it costs to insure your SPY position from a “large” drawdown. You are willing to tolerate “small” drawdowns. Pretty much how I think.
[Losing money is part of investing, losing lots of money is much harder to come back from because return math loses symmetry in proportion to the loss squared. You know how the force of gravity is inversely proportional to the square of distance between 2 bodies? Volatility drag is the gravity of investing.]
We’ll make “large” drawdown less fuzzy. We want to protect ourselves from a loss greater than 1 standard deviation.
Let’s assume that SPY volatility is 16% and we want to hedge using a 1-year put . That’s in the ballpark of a long-term average.
So the question at hand has 2 parts.
- What strike corresponds to 1 standard deviation down?
- What do you think that put costs as a percent of the spot price?
We are interested in sound back-of-the-envelope estimates so here are simplifying assumptions.
- Spot = 100
Round number and it lets us just talk in percents. The 90 strike is the 10% OTM put - RFR = 0%
We don’t want to distinguish between spot and forward price. It’s trivial to adjust as needed.
What strike is 1 standard deviation down?
With a volatility or standard deviation of 16% then the part of the distribution that is further down than 1 SD corresponds to a put strike that is 16% OTM.

That would take us to the 84 strike.
However, we are going to choose the 85 strike.
Being a caveman I like $15 OTM more than $16 OTM well because it’s a 5. Strikes in less liquid names are often in increments of $5 or $2.5 if they are lower priced.
Ok ok, that’s not satisfying enough.
Here’s another reason.
In option math, distances are not measured in simple return (ie 100% - 16/100) but in continuously compounded or logreturn.
If you were being formal you’d solve this equation for K
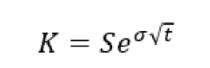
where:
t = 1 year
S = 100
σ = -16% (this is a full standard deviation down. If you wanted 1/2 a s.d. you’d use -.5 * 16%)
Plug and chug and you’d find the strike is $85.21 not $84.
Thought exercise:
In logreturn space is $115 greater or less than 1 standard deviation higher than 100 over the course of a year? The blog post in the caption explains why but you can probably intuit the logic by simply computing ln(115/100) and ln(85/100) and comparing the answers.
Ok, $85 is not just cleaner to my smooth brain, it’s actually closer to the true 1 standard deviation strike.
(Because I am used to strike distances, I had a sense that the strike would be a touch higher than the simple return method would suggest and with reps you’ll get a sense of which way to “round” strikes)
On to the second question:
What is the 1-year 85 put’s premium as a percent of the spot price?
As we move to option prices we start at ground zero…what’s the 100-strike straddle worth?
The straddle approximation is simply 80% of the volatility (scaled by root time until expiry).
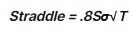
[This handy formula also represents another measure of volatility — the MAD or mean absolute deviation. All of this is covered in the derivation of that approximation.]
Remember T is 1 year so the formula reduces easily to 80% * $16 = $12.80
By definition, the ATF strike is where the call equals the put. If the straddle is $12.80 the 100 strike put is worth $6.40
This might not feel like progress. We know what the 100-strike put is but we want the price of the 85-strike put.
How can we relate these 2 options?
Through a put spread!
If we can estimate the value of the 100/85 put spread then we know the price of the 85 put.
Put spreads, like any vertical spreads, can be thought of as simple distributional bets. At expiration it has a finite number of values from $0 to $15 (the distance between the strikes).
- If the stock expires $100 or higher, put spread = $0
- If the stock expires $85 or lower, put spread = $15
- If the stock expires in-between, put spread = [$100 - stock price at expiry]
An option pricing model can compute a put spread by effectively multiplying every discrete price x the probability of the stock expiring at the price. We need to approximate our way to a similar answer quickly.
Let’s list what we can deduce about probabilities:
- The 100 put is ATM and has about a .50 delta. If the 100 put expires ITM half the time, the put spread expires ITM 50% the time.
- Since the 85 put is 1 standard deviation OTM we know from bell-curves that the stock expires below $85 about 16% of the time.
- If 16% of the time the stock expires below 85, then the remaining 34% of the time it expires between 100 and 85.
- Payoffs
- The 16% of the time the stock is below 85 the put spread is worth $15. Therefore the far downside part of the distribution contributes 16% * $15 or $2.40 to the value of the put spread.
- If we just assume that the 34% of the time the stock the stock expires between 100 and 85 it expires at the midpoint, 92.50, then the put spread expires worth $7.50 34% of the time. 34% * $7.50 = $2.55
Note we are using the same logic as “given that a die roll is greater than 3 what’s the average roll? 5”. - The put spread value can be estimated as $2.40 + $2.55 = $4.95
…let’s bring it together:
100 put ~ $6.40
100/85 put spread ~ $4.95
The 85 put must therefore be approximately worth $6.40 - $4.95 ~ $1.45 or 1.45% of the spot price.
Armed with some logic and the knowledge that the straddle is 80% of the volatility, you are able to estimate how much it would cost to hedge your portfolio against a downside move that exceeds 1 standard deviation!
Pretty cool, but how good is the estimate?
Because we made these estimates assuming a Black-Scholes type world where:
- vol is constant (there’s no volatility skew)
- the stock price is lognormally distributed (logreturns are normally distributed which is why we can use the bell-curve)
…we should see how our prices line up with a Black-Scholes model with flat vols (ie all strikes are 16% vol)
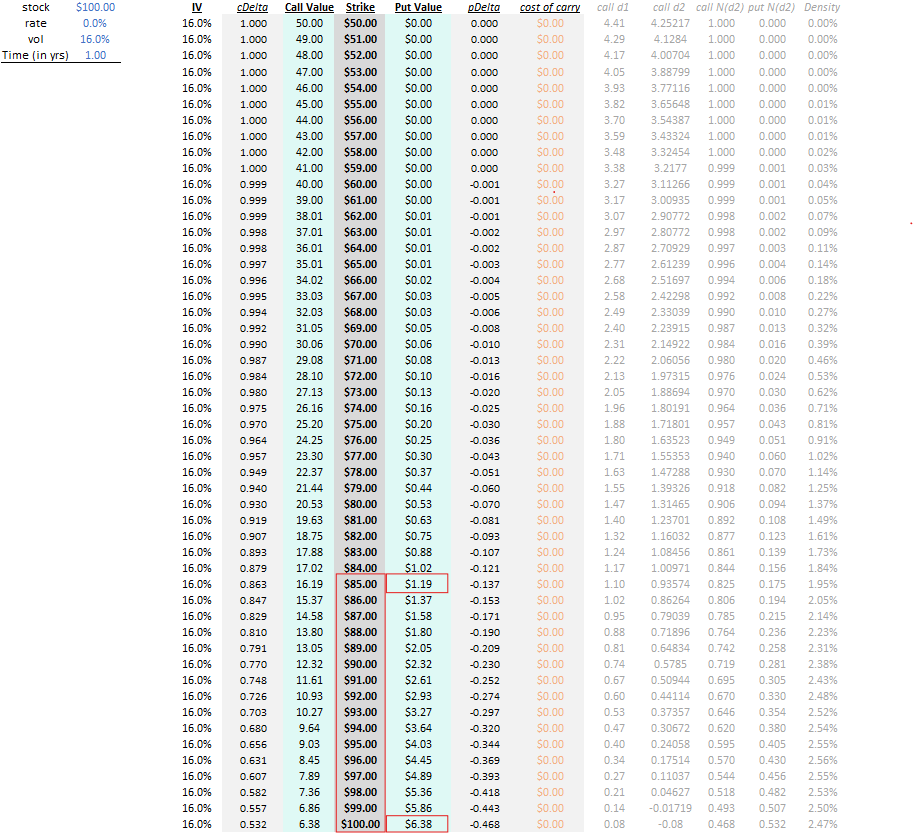
Our estimate vs Black Scholes
100 put: $6.40 vs $6.38
85 put: $1.45 vs $1.19
100/85 put spread: $4.95 vs $5.19
The approximation of the ATM put from the straddle was within 2 cents or 30 bps of the B-S calculation.
However we underestimated the put spread which in turn overestimated the put by $.26 or 21%.
It’s not terrible for mental math but feels like it’s no better than a B on the test (grade inflation amirite?).
Next week…
We’ll discover:
- why we underestimated the put spread (there are clues in this post)
- a way to interpret the price of any vertical spread as a statement that you can bet on. If you want to take a crack at it in the meantime I’ll ask you this: If the 100/85 put spread is trading for $4.95 what specific over/under bet is the market offering you?
- finally, we’ll compare a flat vol put spread estimate with a real-time price to learn how market vols imply a different distribution (the easy part) and why many people interpret it exactly wrong (the counterintuitive part)