
BTC autopsy
IBIT post-mortem
In Sunday’s surfing volatility, I recapped my IBIT (the spot BTC ETF) options trading for the 10 days preceding the March 14th expiry.
That post steps through the conceptual steps and flow of trading “surfing” volatility. I mentioned that trade went about as well as it could have since the stock pinned my short. But that’s reporting results. Evaluating the trade requires decomposing the “vol p/l” because that was the intent of the trade.
Just to recap, Sunday I wrote:
On March 4th, I initially paid 61 vol for the April 38 puts and sold them at 63 at the Mar14 expiry, while the Mar14 48 puts I had sold at 64.5 vol saw their IV get crushed as they pinned near my short strike. The stock was $48.50 when I put the trades on and was trading $48.14 at expiry.
The ratio trade collected $0.67 [I wrote .65 in the last email but as I did the autopsy it was actually $.67] on the small leg upfront. As the fronts expired worthless, I closed out the larger short leg at $0.40 per contract, yielding a total profit of $1.47.
When I break down the attribution, I see a small win on IV (although the vega isn’t as meaningful as the gamma/theta battle on options of these tenor), a giant win on realized, a small loss on delta, and then the positive luck on path which is the short expiring at the strike.
I promised to publish the actual attribution.
From that point of view you will see how I got lucky. But you’ll also see inherent noise in evaluation.
There’s big lessons in this.
We will work through this in 3 steps.
- Actual performance
- Benchmarked performance
- Why they differ and what that reveals about vol trading
Onwards…
Actual Performance
This is the most straightforward part of the analysis. It’s simple. But it also teaches us nothing. Unfortunately, this is where most people stop so learning takes longer (if it ever happens at all).
On March 4th, with IBIT at $48.50, I traded a calendar ratio spread:
- sold 1 March12 48 put @1.79
- bought 2 April 38 puts @.56
I net collected $.67 per 1 lot “on the small side” (language for ratios trades can be weird).
On March14th expiry, IBIT closed $48.14:
- The March puts expire worthless
- I liquidate the April puts at .40 (they have expanded in vol by about 2 points since I purchased them but the vega was small)
P/L per 1x2:
+$1.79 on the March put
- $.16 x 2 April puts = -$.32
Total profit = $1.47 per 1 lot on the small side or $147
[If I traded 10 lots on the small side, ie a 10x20, the profit is $1,470. A 100x200 lot ratio would be $14,700 and so on.]
Summarizing*:
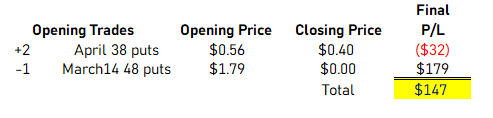
Hooray, right?
Not so fast. This is just “resulting”. Trading is too noisy to learn from that.
Let’s go deeper.
*I actually did another trade which made the performance even better but adding another trade at a different date complicates the coming analysis which I want to keep approachable. I’ll mention it at the end. It’s more interesting as a matter of “vol surfing” rather than direct attribution but it also highlights just how dynamic option trading is.
Benchmarked performance
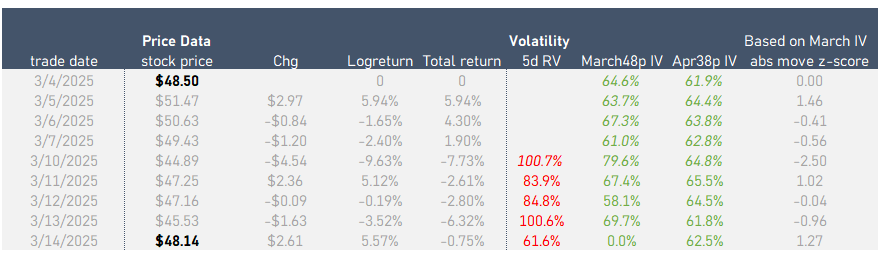
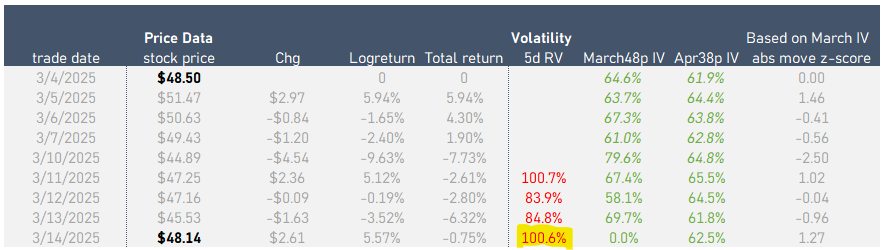
This table shows where the stock was when I first did the trade, the change in stock prices during the holding period, and there the stock was at expiration when the trades were closed.
To annualize a daily move into a volatility you can multiply by 16. Notice how large the daily moves have been since I sold the options. 4 out of 8 days the moves were greater than 1 st dev with 1 exceeding 2 st devs (st devs as implied by the March IV).
Once we have 5 returns we compute a 5-day realized vol. The closing IV is always less than the RV (although intraday the IVs did whip around a lot). Negative VRP!
This table shows the total greeks as if the position is short 100 March puts and long 200 April puts:
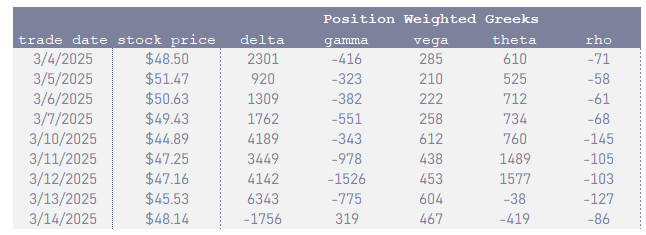
Things to note:
- The position is short gamma. Even though its long 2x as many April options as it is short March options. That’s because the shorts are closer to expiry and closer to the stock price than the April 38 puts.
- The closer the stock is to $48 and the less time to expiry there is, the larger the short gamma position, and the larger the theta collection.
- At expiration, the stock expires above the strike. Going into the expiration I’m short gamma so above the strike my position becomes short as my March puts “go away”. My greeks at the end of the day, reflect my April puts — now I’m short delta, long gamma and vega, paying theta.
Estimating p/l attributable to greeks
✔️Realized p/l = gamma p/l + theta p/l
where gamma p/l = .5 x gamma x (change in stock price)²
✔️Vega p/l = vega x change in IV
Over the life of the trade, the position wins to April vega p/l but those gains are swamped by the sheer size of the gamma/theta tug-of-war.
If I hedge daily…
I’m losing that battle.
The negative gamma p/l dominates the daily decay because the moves are larger than what’s implied in the vol (which determines how much theta I collect — in this case, I’m “not collecting enough” to compensate for the short gamma).
To evaluate a vol trade you need a benchmark just like if you buy a stock you might benchmark the decision in comparison to how the SPX or QQQ did over the holding period. Since this is a relatively short-dated trade, benchmarking to “how did my position behave assuming I hedged my deltas daily” is a solid idea.
Here’s how that looks:
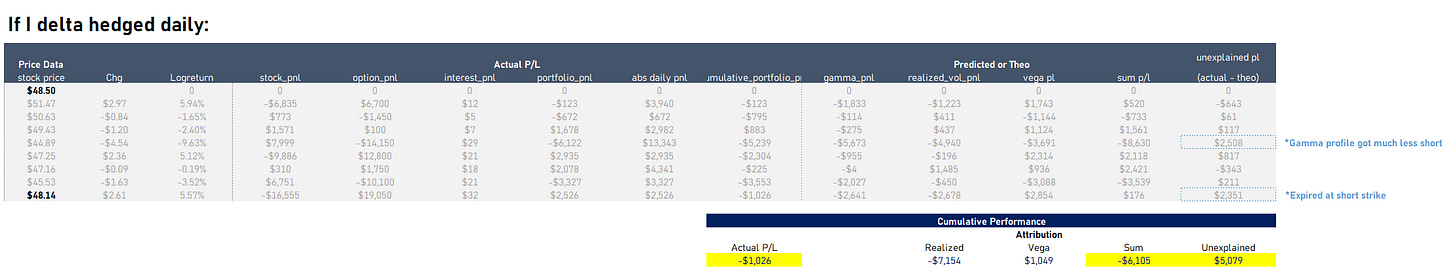
The trade won small to vega, lost big to realized, but the attribution decomposition overestimates the loss because the gamma profile wasn’t as short on the large down move because of vanna.
💡Vanna is a second-order greek we are not attributing. It can intuitively be understood in words: “when the stock was at the bottom it was far away from the March shorts and closer to the April longs and therefore lost a lot of short gamma on the move”. The gamma p/l estimate assumed constant gamma across the move. You can imagine how if we computed gamma p/l over every $.50 interval it would progressively decline as the stock kept approaching our long options. The assumption of constant gamma therefore overestimated the loss in this case and that overestimate is accounted for as positive “unexplained p/l”.
Back to the attribution. Here’s a visual of the hedged p/l vs the stock price (left panel) and p/l vs move (right panel).
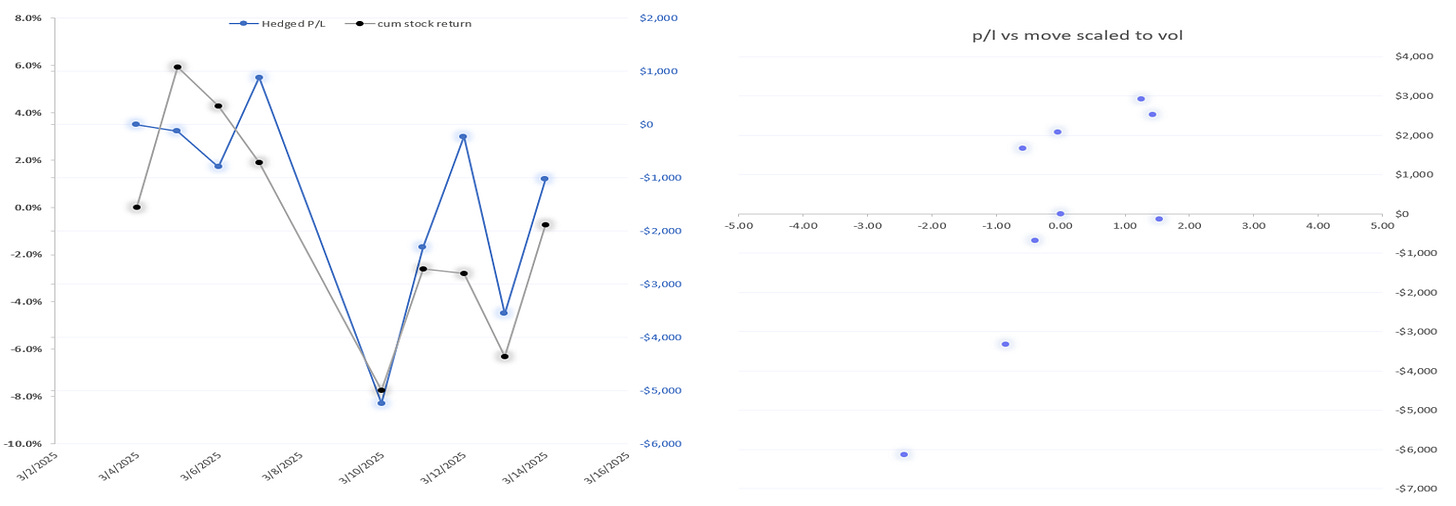
The 100x200 lot ratio spread, delta hedged daily (assuming no slippage) lost about $1,000 or a dime in option terms.
$1,000 = $.10 x 100 contracts x 100 multiplier
If this trade was done with 1x2 contracts only it would have lost $10 (ie a dime on a 1 lot).
In sum, benchmarking the decision to do the trade to “what if I hedged it daily” the trade is a small loser even though the realized vol over the holding period was much higher than the IV sold.
The 2 primary forces that kept the theoretical loss in check were:
- When the stock was most volatile (on the down move) my gamma became much less short. This is why I wanted the downside. I expected BTC vol to outperform the skew as I expected the down move to be “destabilizing” (just as it has been in other risk assets recently…I would expect the opposite for something like gold).
- The stock expired at the short strike. I’ve discussed this before but it’s the roulette aspect of these dirty vanilla options. See Short Where She Lands, Long Where She Ain’t
Actual vs Benchmarked Performance: Why they differ and what we can learn from that
Recall, my actual performance was making $147 per one lot vs a “hedge daily” benchmark of losing $10.
What the hell is going on here?
Remember last week’s post a misconception about harvesting volatility?
I wrote:
By hedging your delta at various time intervals or as your position size breaches a threshold, you are first and foremost reducing market exposure risk. You do this because you don’t want directional p/l variance to swamp the vol-driven reason for doing the trade. A byproduct of this is your hedges “sample the vol”. If you hedge on the close every day and the market always comes back to unchanged after having large intraday ranges, you will sample a zero volatility. If you hedged intra-day you will sample a much higher volatility.
There’s no escaping the reality — every option trader experiences their own realized vol regardless of what the close-to-close volatility says unless they hedge close-to-close. If you benchmark realized volatility as close-to-close, you could think of your sampling as ‘volatility tracking error’ even though there is no “single volatility”.
Your hedges might sample the vol, but the intent is to cut risk, ie manage position size. You can appreciate this by considering the opposite extreme — you do option trades for volatility driven reasons but you never hedge.
What happens?
You are still trading vol. The expirations are the moments when you “sample” vol. The realized vol you experience is point-to-point volatility over longer stretches of time. It’s just hedging on a long interval.
I didn’t plan it this way. That post came out Thursday morning. I didn’t know how my Friday expiry position was gonna turn out. But the difference between my actual p/l and the theoretical p/l if I hedged daily is a perfect example of that quote.
I did not do any delta-hedging. I was prepared to own the shares if IBIT closed below the strike and sized the trade, which was driven by a vol axe, to be ok with an unhedged outcome. If you recall this video, I showed exactly how I studied what a disastrous result could look like:
Still, why was my actual performance much better than the delta-hedged counterfactual?
By not hedging I only sampled the vol in 2 places. I sold the near-dated 48 strike puts with 10 DTE when the stock was $48.50.
At expiry, the stock was $48.14.
Despite all the whipsawing, the 10-day point-to-point return was a measly -.75% and I was short 65% vol. I won to being an ostrich.
Of course, this is luck and not a strategy. If I bought the options and didn’t hedge I wouldn’t have “sampled the high volatility” and would have gotten slammed.
You can’t know the path.
The benchmarked “delta-hedged” performance of the position is a better measuring stick of a vol trade than looking at what happens if you do nothing since part of the reason for trading the vol was a comparison of the implied vol to the daily realized vol. You can’t pretend the daily realized vol doesn’t matter when you do an autopsy.
You may not agree that “daily delta hedged theoretical performance” is the right benchmark for what you are doing, but just “resulting” is active self-deception. If you trade over longer time scales the vega attribution will gain relative importance. You might even benchmark realized vol using weekly sampling. If you trade dailies, you can probably just compare straddle prices to dollar moves and ignore IV measures altogether. Whether it’s report cards or stopwatches, students and athletes don’t get better without measuring. The same is true for traders.
A humble bit of advice: to get better, construct benchmarks in light of the metrics that drive your trading decisions.
Wrapping up
My actual performance was much better than a more platonic version of how I should have done. I’ll take it. The opposite happens too. Vanilla options are filthy. If you love being fooled by randomness and like to brightside your results, options will give you all the rope your heart desires.
I recommend assassinating your ego and looking at the chalk outline. The IBIT autopsy report:
- Sold an IV that turned out to be too low (bad)
- Owned a downside put ratio (good risk management and judgment about how vol would react on a large risk-off)
- Got lucky on pinning the short
Final note
I mentioned that I did another trade in the fracas that I didn’t include in the attribution because it was done on a different day.
Let’s talk about that one.
Near the depths of the sell-off with vol ripping, I launched another clip of puts. This time the March14 43 strike at $.77 with the stock around $45 (they were about 85% IV) or about 20 vols richer than my April puts.
Here’s the scenario. I’m getting worked because I’m long delta as my short $48 puts are now $3 ITM but I’m long 2x as many April puts which are picking up greeks as my March puts are losing vega and gamma.
In other words, I got bullets. This is not an accident. This is in the DNA of how I trade (the readers who’ve spent a lot of time trading beside me are laughing right now because they know exactly how I’m thinking…pit trader to the f’n bone).
Now I can sell when they’re really coming for it. Those teeny puts’ value don’t come from some actuarial place. It’s from the dynamic understanding of how things trade when shtf. I didn’t buy the ratio to go to the grave with it but so I can paint. IBIT is down nearly 10% and vol is singing. So I monetize some of these extra options that have greeks. But instead of selling the April puts I sell the March 43 puts because that’s what the market is paying up for.
To be clear, this is risky. I’m taking calendar spread risk. I’m also not hedging. My risk is capped of course, if IBIT goes to zero I ride the long shares down to $38 but then the pain is over.
However, if IBIT rips back up to $55 all I’ve done is collect premiums. The p/l will be positive but the autopsy will say “this man left a lot on the table by being short vols that turned out to be a buy”. Let’s not sugarcoat short gamma.
As it turned out, those $.77 options expired worthless so the entire series of trades amount to $224 per contract of profit ($147 for the first package + $77 for the additional puts) per 1 lot.
[Again, just basic option accounting — if you sold 100x200 ratio then sold an additional 100 puts then you are net flat option units. The p/l at expiration is $22,400.]
All of that said — the second batch of sales also fail an honest attribution lens. The 5-day rv that prevailed after selling 85% vol was 100.6%.
[I’m reminded of the wild Oct 2009 nat gas options. There was no IV level that ever traded that was above the realized vol. Vol got over 100% and it wasn’t enough. But that lasted much longer than this boondoggle.]
On a point-to-point basis, it is a 7.2% move in 4 days or ~57% vol move.
[7.2% * sqrt(251/4) = 57.3% ]
Note that the up and down is worse than if the stock went up 2% per day for 4 days. Even though that move would have been further, in a delta-hedged strategy it’s more benign. The whippiness is like a treacherous course through the mountains that would otherwise seem short if you measure by “how the crow flies”.
Options are fascinating because they must balance both path and destination. 2 investors can trade with each other, one based on path and one based on destination and both win. At the macro level, the participant who gave liquidity to the delta-hedger lost. Just imagine buying the 43 call for 50% vol and the stock goes up 2% per day for 4 days. The call seller who hedges daily and the call buyer who goes on vacation both win. The trader who sold the hedger shares all the way up holds the bag. Of course, we’re anthropomorphizing a system here but you get the idea.]
To repeat what I said earlier, this second trade is more interesting as a matter of “vol surfing” rather than direct attribution. It highlights just how dynamic option trading is. It’s a 3D boardgame that slides along a time dimension. I’ve alluded to a lot of this conceptually in my writing over the years but with the moontower.ai visor on I’m getting my sea legs back bit by bit which means I can get more concrete.
If you are reading this as an options novice with a process for using options already, I’m not advising or encouraging you to invite this kind of brain damage into your life. The tools are useful for much simpler options applications because they are, say it with me, always about vol (with an exception for vertical spreads but our Payoff Visualizer has you covered for that anyway).
Let’s leave it there.