
A Cockpit View Of Q3
Q32024
I recently built this cockpit view to see what’s going on in markets. I’ll be iterating on it as well as creating a page to incorporate my portfolio so I can do some high level bucketing by asset class, vol weights, and portfolio correlation. It won’t take much to get it to a suitable template for the personal account.
I’ll probably add proxy benchmarks to mimic private fund holdings that hold public securities. However, there won’t be accounting for angel investments. I hold them at cost on the spreadsheet and at 0 in my brain regardless of their “valuation”. If anything hits, I figure my kids will thank me one day. If not, and I trained them well, they’ll drag me over the foregone beta return. They own a lookback option on our sense of guilt. That goes beyond finances I’m sure.
We’ll talk about the cockpit view briefly before using it to describe Q3.
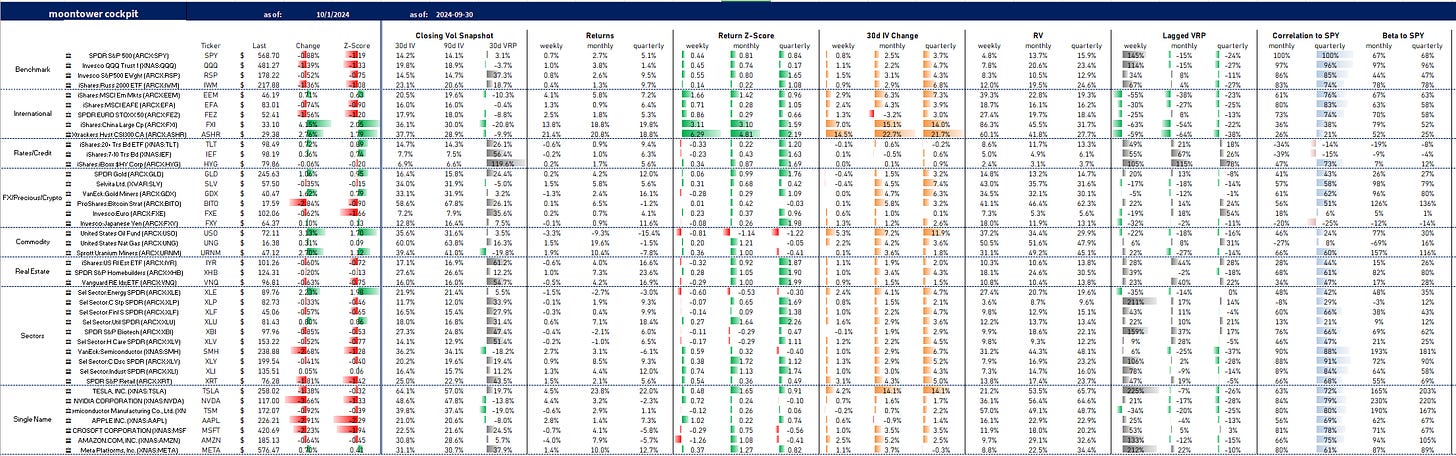
1) Columns Worth Clarifying
- Change: Logreturn (%) from the previous close (current data).
- Closing Vol Snapshot: Implied volatility as of T-1, includes:
- 30d IV: Implied volatility for the next 30 days.
- 90d IV: Implied volatility for the next 90 days.
- 30d VRP: (Forward-looking 30d implied volatility) / (1 month realized vol) - 1
- Return Z-Score: Normalized asset return based on implied volatility from a week, month, or quarter ago.
- 30d IV Change: Change in 1-month constant maturity IV over the past week, month, quarter
- Returns (weekly, monthly, quarterly): Asset returns for the specified periods,
- RV (Realized Volatility): Annualized historical volatility calculated using daily log returns. Monthly RV is computed using 21 days of data for example.
- Lagged VRP: Ratio of realized volatility that transpired compared to implied volatility from a month or quarter ago for example.
- Correlation to SPY: return correlation for specified lookback
- Beta to SPY: computed as realized vol ratio x correlation for lookback
2) Some insights from the cockpit view
- 30d IV is up across the board on weekly, monthly, and quarterly time frames despite asset return also being up everywhere except oil.
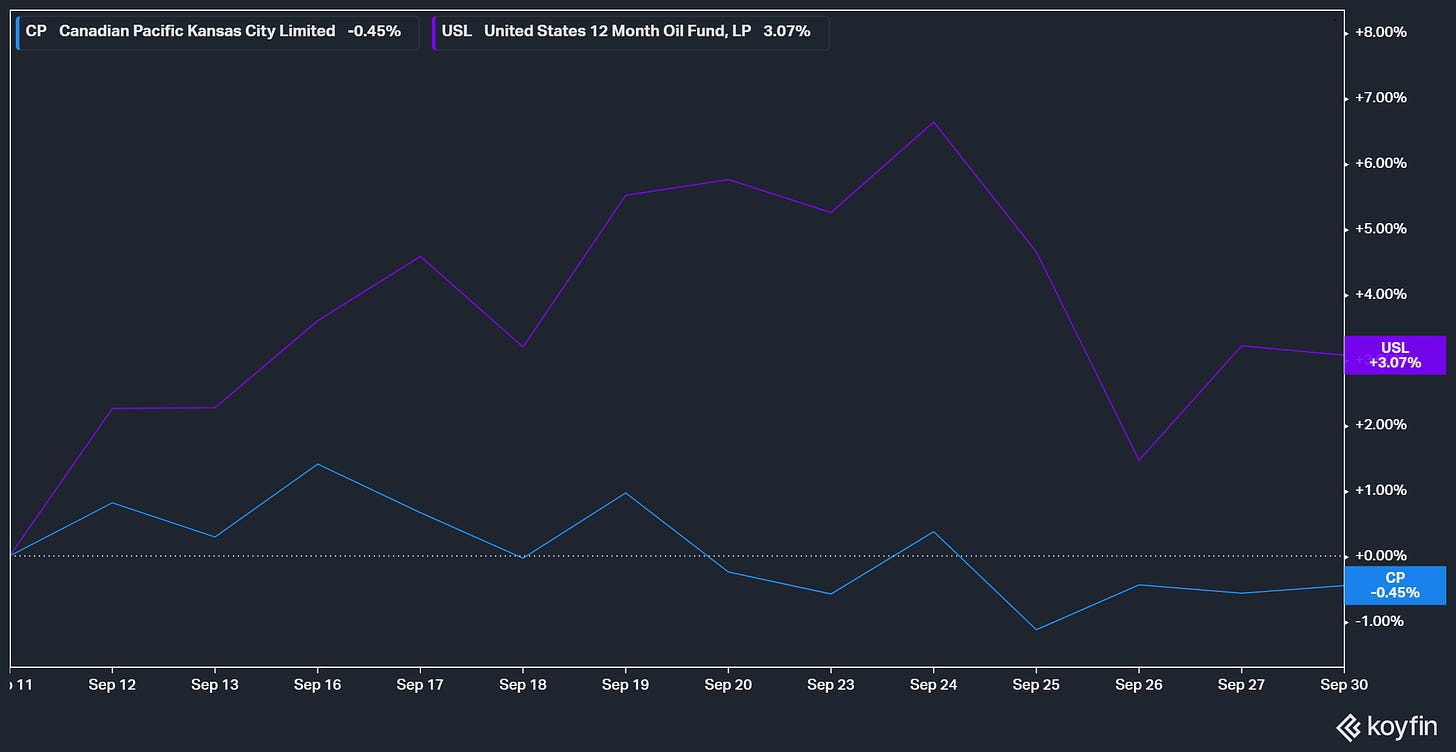
I bought oil and sold stocks back on 9/11/24 when it seemed like a nice rebalance entry. I was wrong on the oil vol sale, but right on direction…I synthetically sold puts in oil vs selling railroad shares (CP)…see commodity kamikaze
- Short vol did well last week (see lagged VRP) in US index and sector index. It got WRECKED in China ETFs with weekly return Z-scores greater than 3 standard deviations (Return Z-Score column).
- Quarterly returns in SPY and IWM were close to 1 standard deviation (return / implied vol from 3 months ago). QQQ flattish as gains in TSLA, AAPL, META were washed by flat or losing results in semis, MSFT, AMZN.
- Bonds unsurprisingly had a strong quarter with rates falling but the lagged VRP showed vol was overpriced.
- The euro, yen, and gold all rallied strongly against the dollar this past quarter. BTC was flat.
- XLU (utilities) were the strongest SPX sector but utilities have bond-like properties so they seemed to inherit both the stock and bond rally. Their trailing correlation is low being pulled in opposite directions by SPY and TLT.
- The trailing 3 month realized vol performed well compared to how implieds were priced in late June. The August 5th chaos made its mark.
While I got the USO vol trade wrong, the GLD short vol idea carried well.
I threw this on Twitter yesterday:
The discomfort of short vol (this might have something to do with why it often pays):
On 8/16, I wrote about the GLD Nov 232 ATM call looking fat over 17% IV
The call was ~$9.40
Shorts have made nearly $2 on delta-hedged basis
But notice what's uncomfortable...

GLD is up nearly 5% since then (as of 9/30)
Strike vol did come in hard and stay subdued for about a month after I wrote the post.
It's recovered recently but the strike vega is much smaller with over a month elapsing & the call being .81d (not ATM anymore)
3) Using Excel to pull stock data
A 1-minute video:
Lots of fields:

There’s even a stockhistory() function.
I hope the cockpit view inspires your own ideas. We will be bringing a very similar version to moontower.ai
If you use options already, definitely check it out. It’s option trader goggles. Vol traders already understand the lens but if you are a directional or fundamental trader who is even curious about options the Primer and Mission Plan docs offer surgical ways to expressing your views. And if the cockpit is any indication, option metrics alone are useful for thinking about risk and opportunity even if you don’t trade options.
That’s the premise of Option Analytics For All.
Some headings from that post:
Option Surfaces As A Unique Source of Market Intel
- The typical use of option analytics
- Intelligence from options markets
- A Brief Detour into the World of Indicators
- Option analytics as indicators for non-option users